Monitor Usage & Billing
Open Usage & Billing
In the left sidebar, under Dedicated Inference, click My endpoints, then click the Usage & Billing tab.
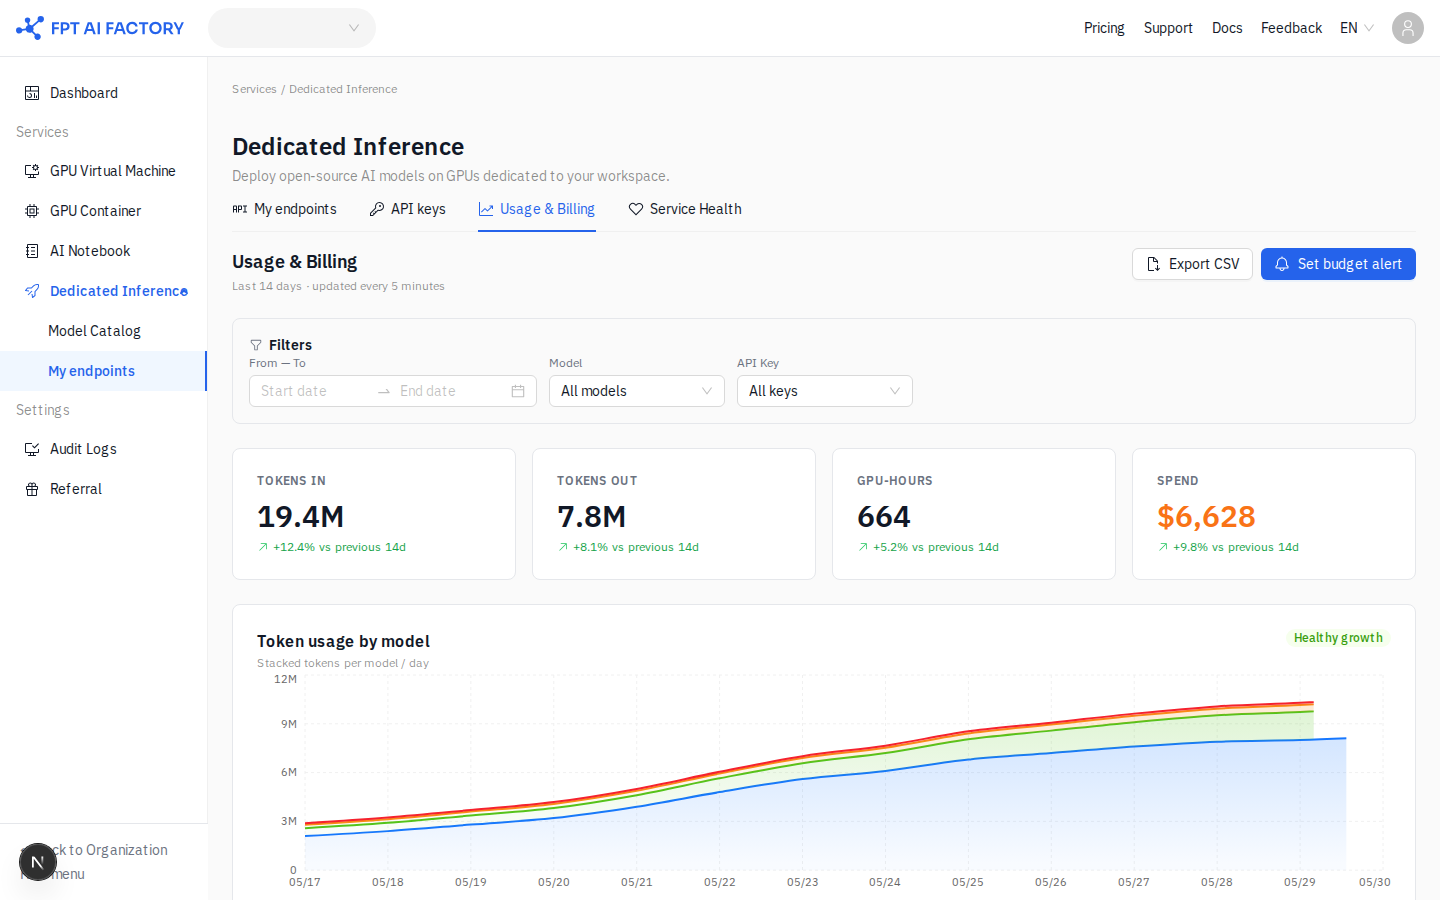
Page title: Usage & Billing Last 14 days · updated every 5 minutes
Filter the View
Use the Filters section to scope all charts and the table simultaneously:
| Filter | Options |
|---|---|
| From / To | Date and time range |
| Model | All models or a specific model |
| API Key | All keys or a specific key |
KPI Cards
| Card | What it shows |
|---|---|
| TOKENS IN | Input tokens consumed in the selected period |
| TOKENS OUT | Output tokens generated in the selected period |
| GPU-HOURS | Total GPU-hours reserved — this is what drives your bill |
| SPEND | Total cost in USD for the selected period |
Each card shows the percentage change vs the previous 14 days.
note
TOKENS IN and TOKENS OUT are tracked for analytics only. Billing is capacity-based (GPU-HOURS), not per token. Billing is per-minute with a minimum of 60 seconds, rounded up.
Charts
- Token usage by model — Stacked tokens per model / day: shows token consumption per model over time.
Export Data
Click Export CSV to download the filtered data as a CSV file for reporting or finance submissions.
Set a Budget Alert
Click Set budget alert to configure a monthly spend threshold. You receive a notification when spend reaches the configured level.