Guide: Viewing and Filtering the Activity Log
This guide describes how to view the activity log and apply filters to find specific events within a VPC.
Prerequisites
- You must be working in the context of a specific VPC.
- You must have permission to view the activity log for that VPC.
Step 1 — Navigate to Activity Log
-
Select the VPC whose logs you want to view.
-
From the left navigation bar, select Activity Log.
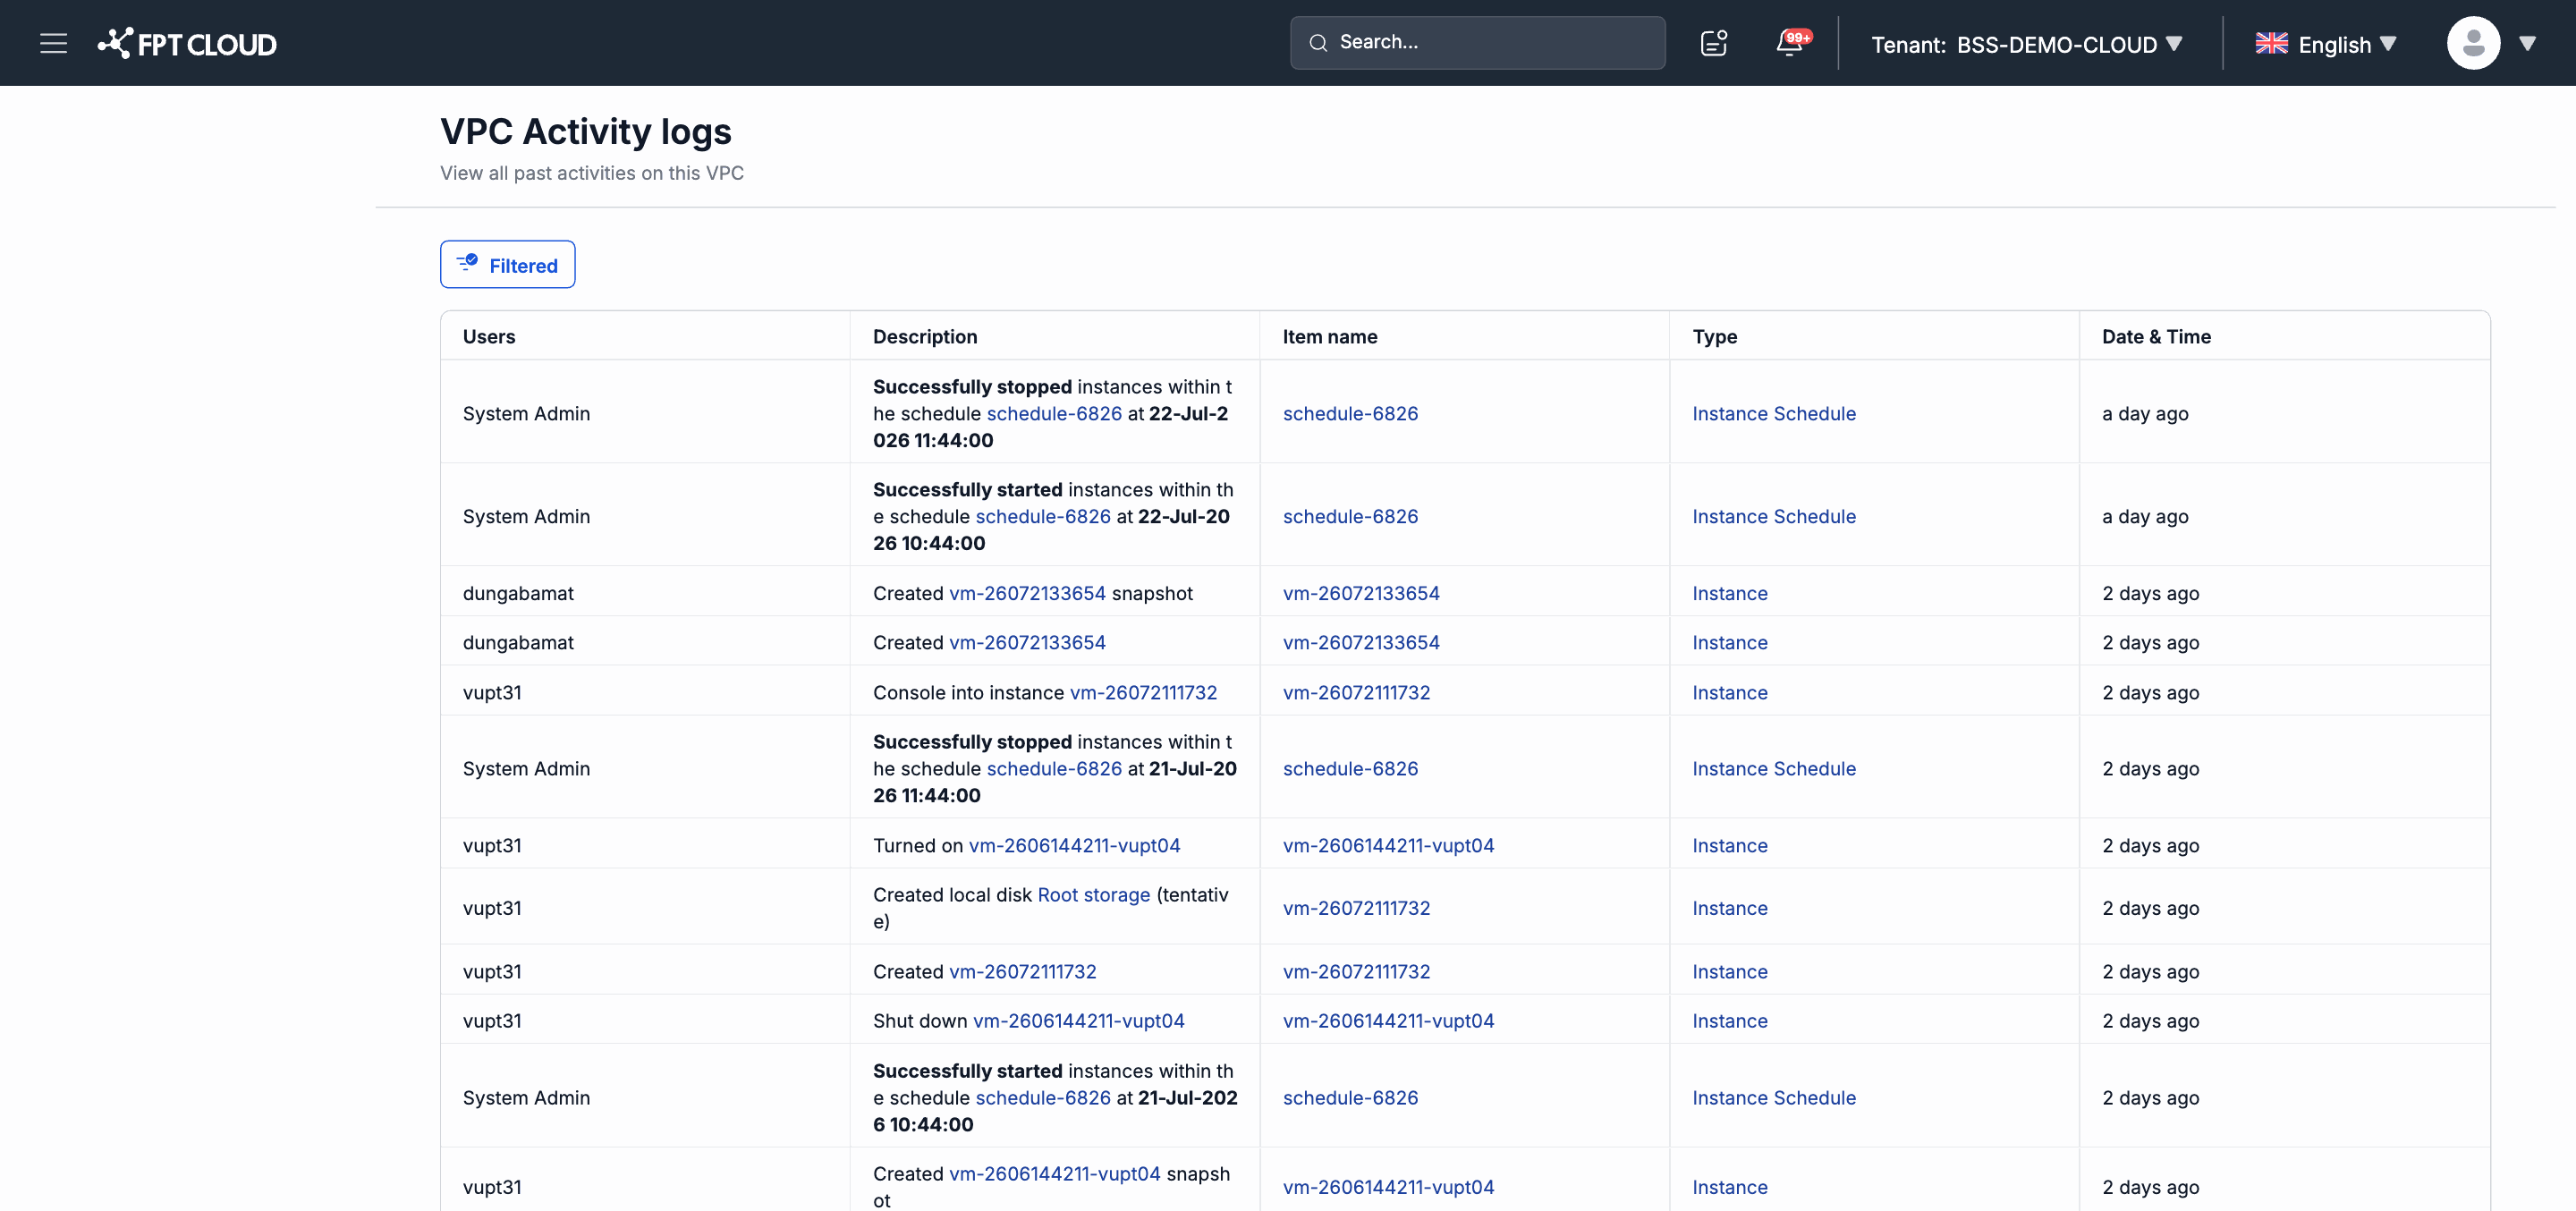
The activity log page appears.
Step 2 — Read the Log Table
The log table lists events in reverse chronological order (newest first) with the following columns:
| Column | Description |
|---|---|
| Users | The user who performed the action. |
| Description | A short description of the recorded action. |
| Item name | The name of the affected resource (e.g., an Instance name, a VPC name). |
| Type | The action type (e.g., Create, Delete, Update). |
| Date & Time | When the action occurred (UTC). |
Use the pagination bar at the bottom of the page to browse through multiple pages of results.
Step 3 — Filter the Log
-
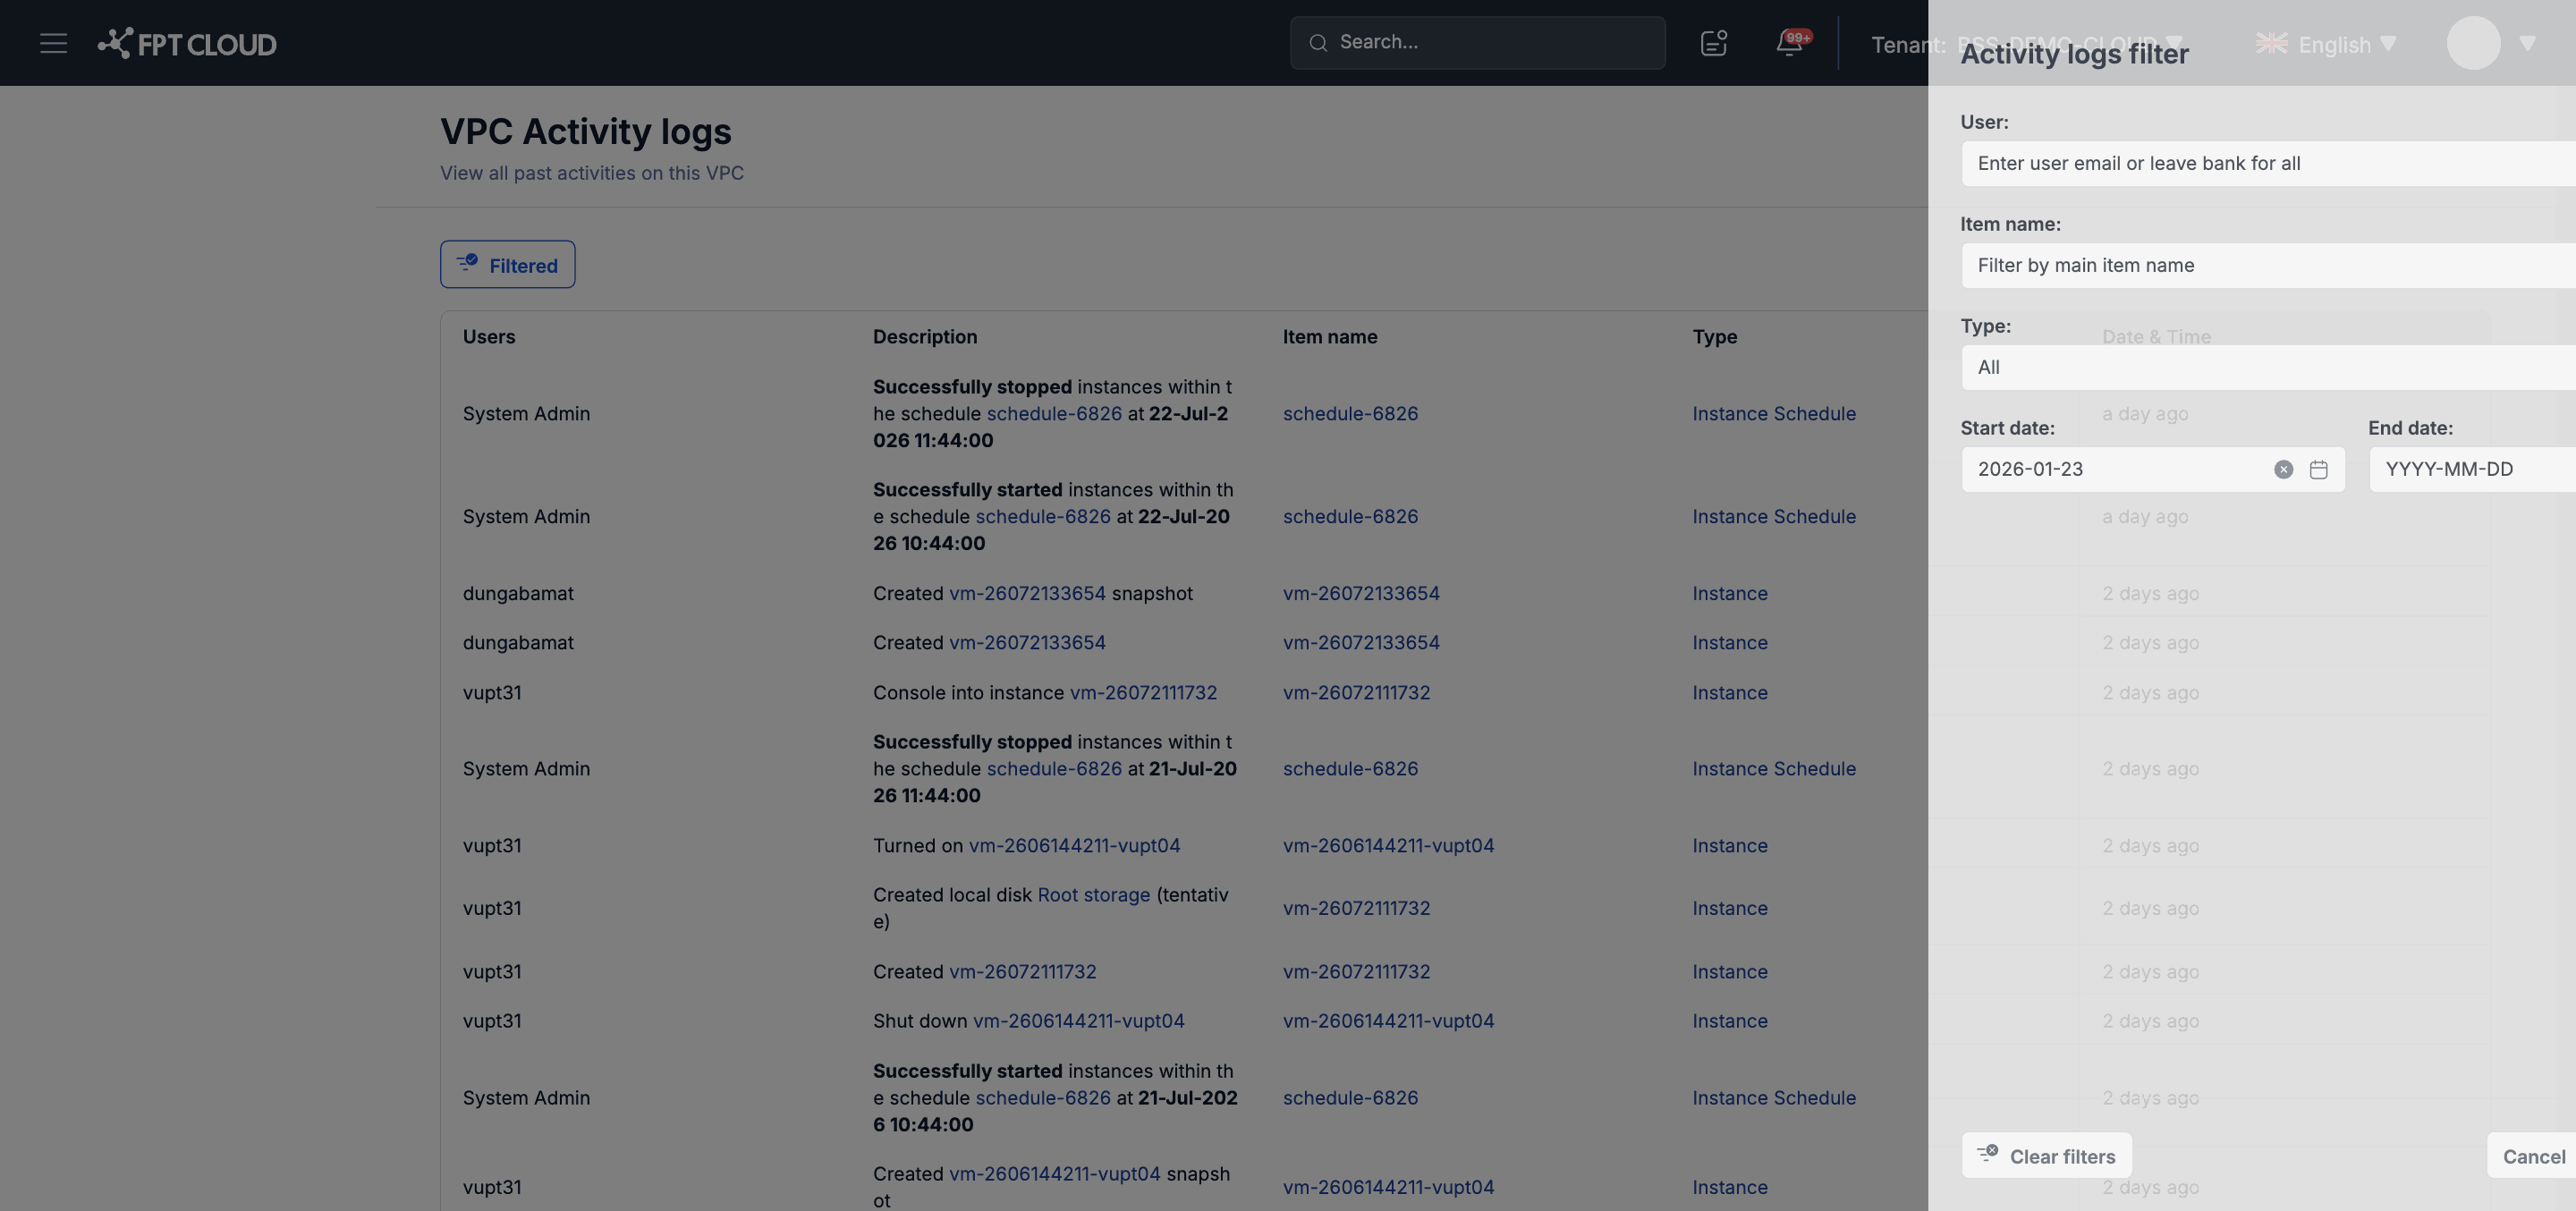
Click Filtered to open the filter panel.
-
Enter your filter criteria:
| Filter Field | Description |
|---|---|
| User | Filter by user email address. Leave empty to show all users. |
| Item name | Filter by the name of the affected resource. |
| Type | Filter by action type (Create, Delete, Update, etc.). |
| Start date | The start of the time range to filter (format: YYYY-MM-DD). |
| End date | The end of the time range to filter (format: YYYY-MM-DD). |
- Click Apply (or Filter) to apply the filters.
Note: You can combine multiple filter criteria at once to narrow the results.
Limitations
- Activity Log does not support file export. You can only view data directly in the interface.
- The log shows activity within the current VPC only — activity from other VPCs is not shown.