Monitor a workspace
Follow the metrics of the services in your workspace on a monitoring dashboard. Connect the workspace to the Monitoring Workspace, then import the dashboard template.
Prerequisites
- Permission to view the Monitoring tab of the workspace. Without it, the tab shows "You do not have sufficient permissions to view this page!".
- The dashboard template of the service you want to monitor. See Download a dashboard template.
Connect the workspace to monitoring
- Select Data platform → Workspace management, then select your workspace.
- Select the Monitoring tab.
- Check the Monitoring Workspace details in the table.
- In the Action column, select Integrate.
The portal connects the workspace to the Monitoring Workspace.
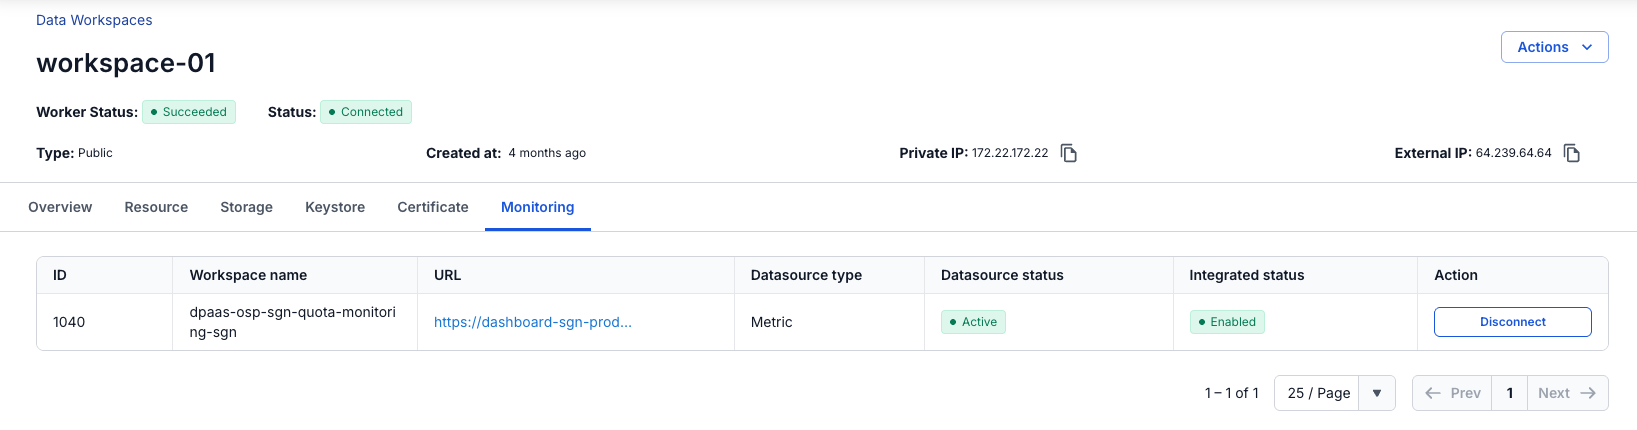
| Column | Description |
|---|---|
| ID | The ID of the Monitoring Workspace. |
| Workspace name | The name of the Monitoring Workspace. |
| URL | The link to the monitoring dashboard. |
| Datasource type | The datasource type, Metric. |
| Datasource status | Activating, Active, Active Failed, Inactive, or Deactivate Failed. |
| Integrated status | Enabled or Disabled. |
| Action | Integrate connects the workspace. After the connection, the button changes to Disconnect. |
A connected workspace shows Active in Datasource status, Enabled in Integrated status, and Disconnect in the Action column.
After you select Disconnect, the workspace stops sending monitoring data to the Monitoring Workspace.
Open the monitoring dashboard
Open the dashboard after the workspace is connected.
- Select Data platform → Workspace management, then select your workspace.
- Select the Monitoring tab.
- Select the link in the URL column.
The monitoring dashboard opens in a new browser tab.
Download a dashboard template
Each service has its own dashboard template, a JSON file. Download the template of each service you want to monitor.
| Service | Template |
|---|---|
| Orchestration (Airflow) | airflow-dashboard.json |
| CDC Service | cdc-dashboard.json |
| Flink | flink-dashboard.json |
| Query Engine (Trino) | trino-dashboard.json |
Import the dashboard template
Import the template to get a dashboard for the workspace's services. Do these steps in the monitoring dashboard.
- In the left menu, select Dashboards.
- Select New → New folder.
- Enter a folder name, for example
Workspace Monitoring, then select Create. - Open the new folder, then select New → Import.
- On the Import Dashboard screen, select Upload JSON file, then choose the template file you downloaded. You can also drag the file onto the screen.
- Select Load.
- Check the dashboard Name, UID, and Folder.
- Select Import.
The dashboard is created and shows the metrics of the service. Use the lists at the top of the dashboard, such as Workspace, to choose what it shows.