Monitor database cluster with FMON
Monitoring gives real-time visibility into cluster health, performance, and resource use. It integrates with FPT Monitoring (FMON) to collect metrics and logs, and surfaces them through Grafana dashboards.
Use it to spot anomalies early, evaluate query workload, and decide whether a resource change is actually needed.
Enable monitoring
Monitoring is not self-service. Access the Monitor tab and the behaviour depends on whether it has been enabled for your cluster:
- Log in to FPT Cloud Portal. From the main menu, select Database Platform → All Databases. Click the Cluster ID and open the Monitor tab.
-
Not enabled — the page prompts you to contact FPT Support.
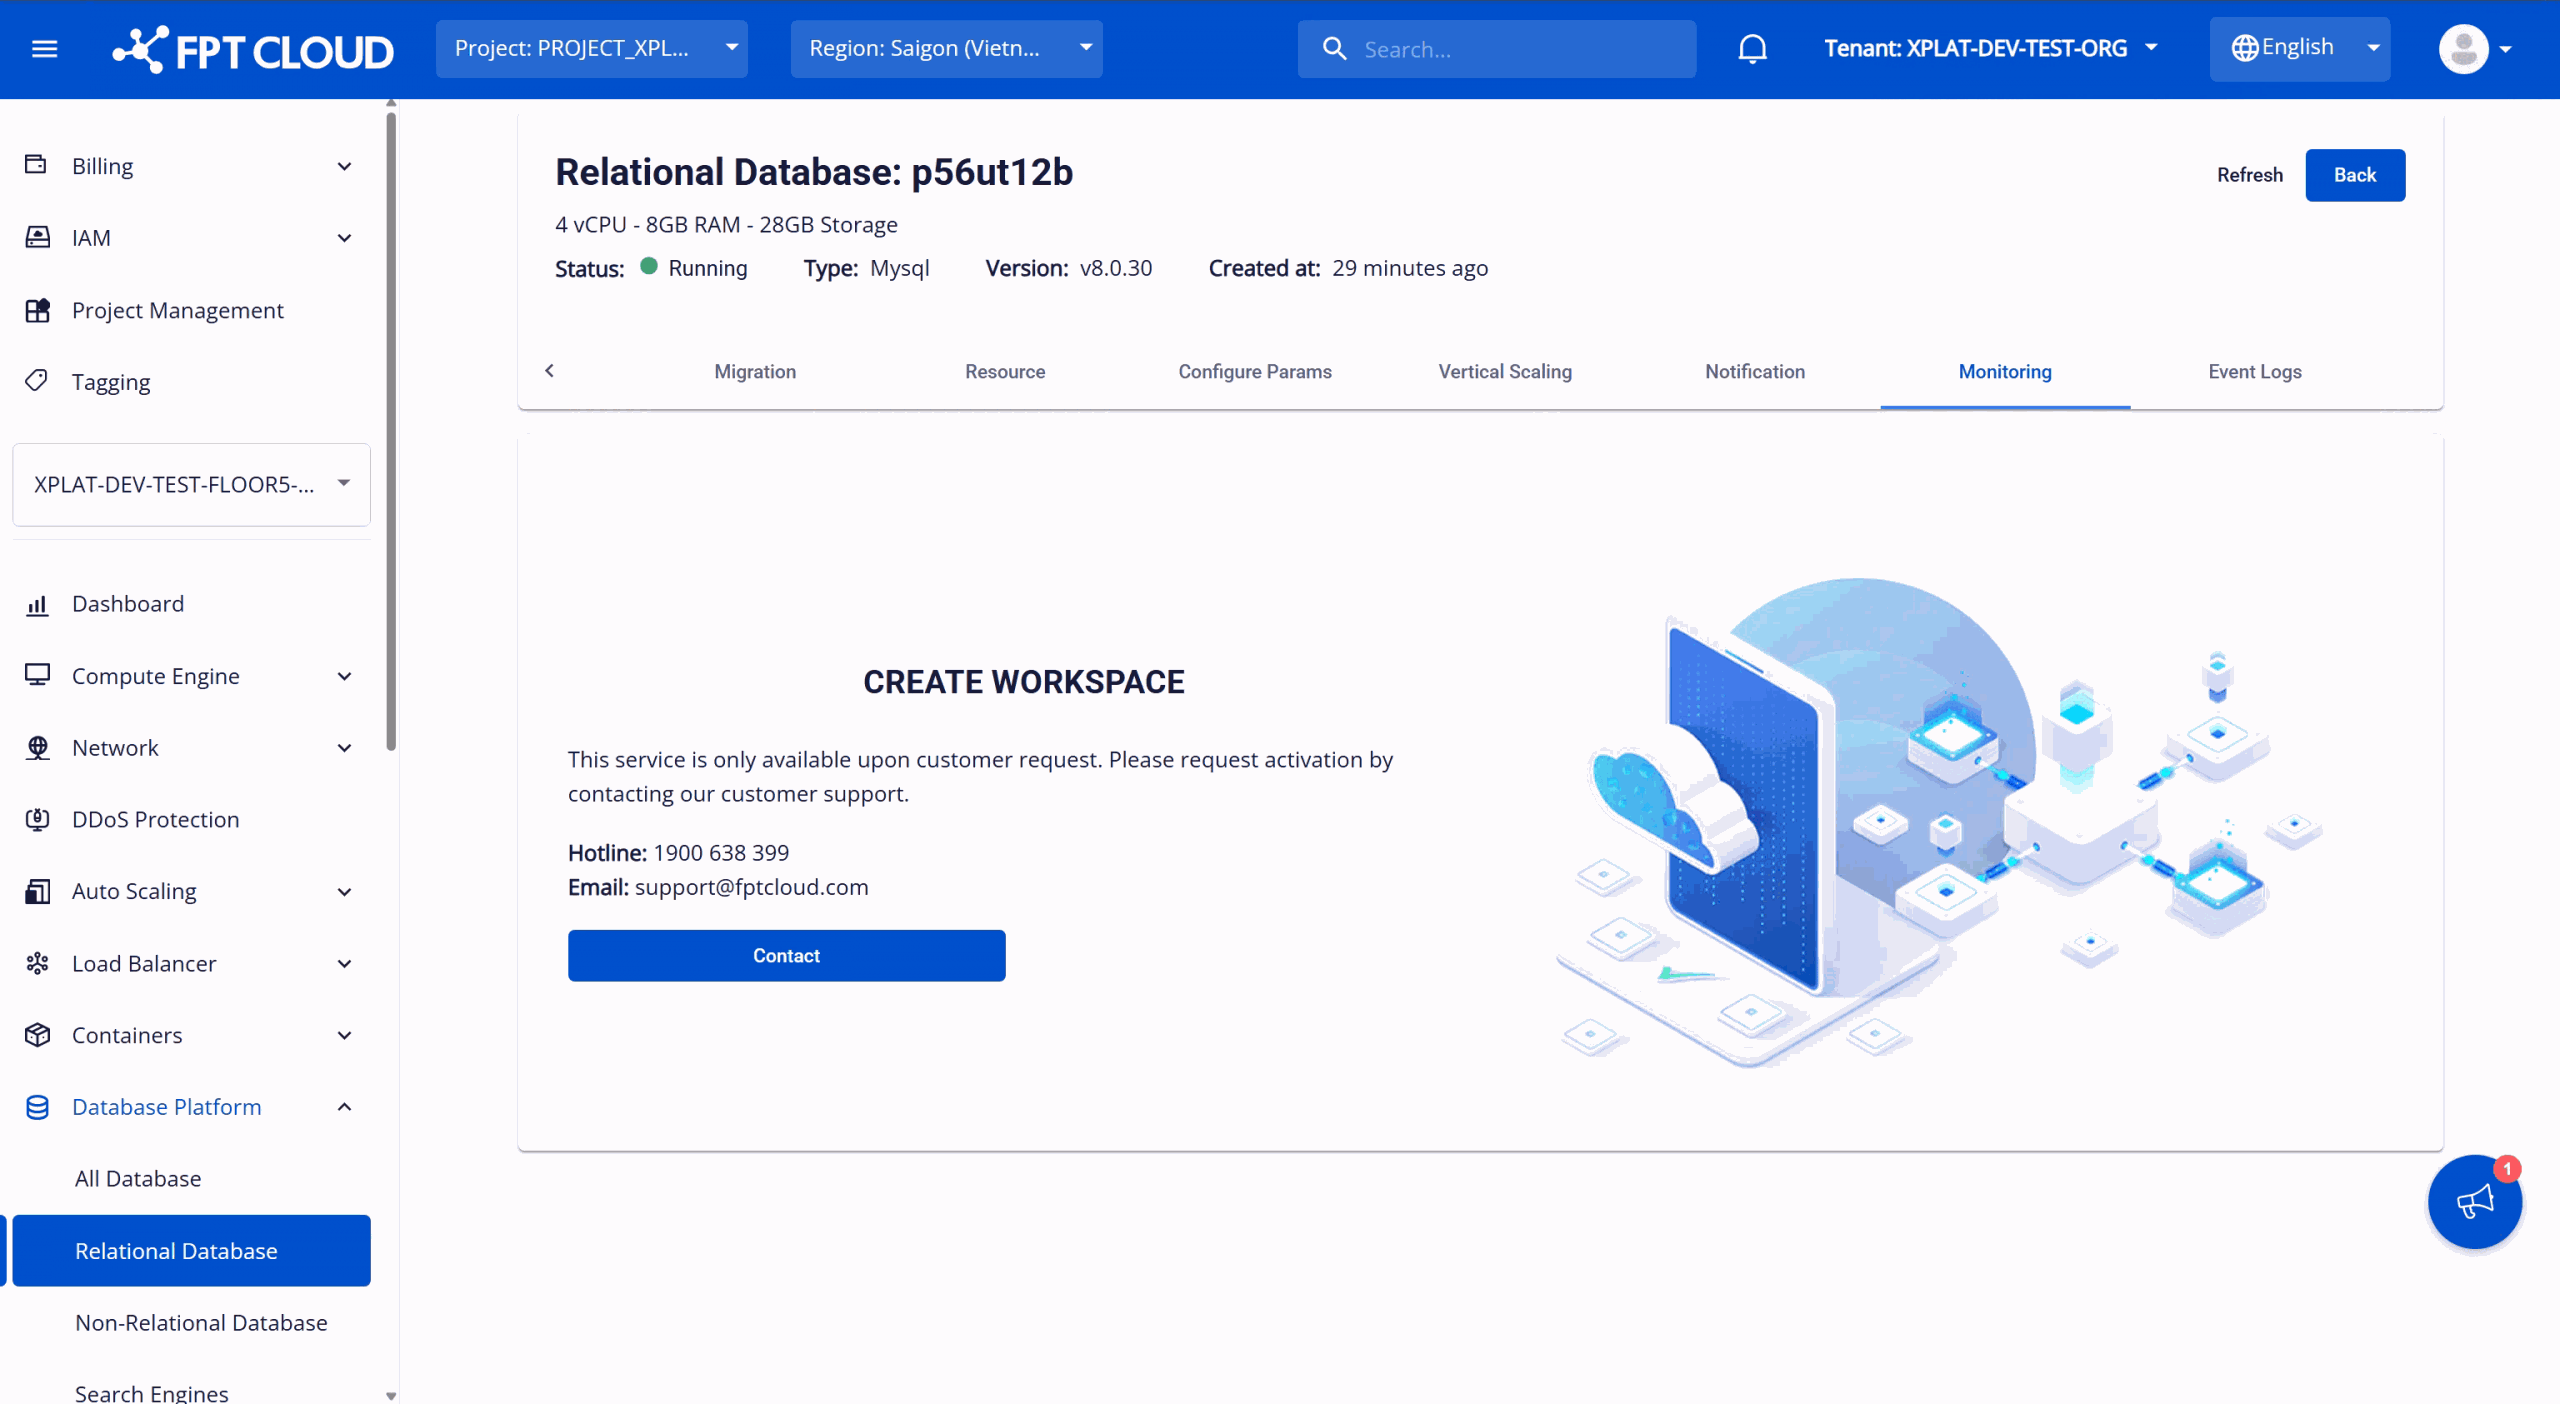
-
Enabled — the page lists database metrics and logs. Anything not yet integrated shows integrated status Disabled.
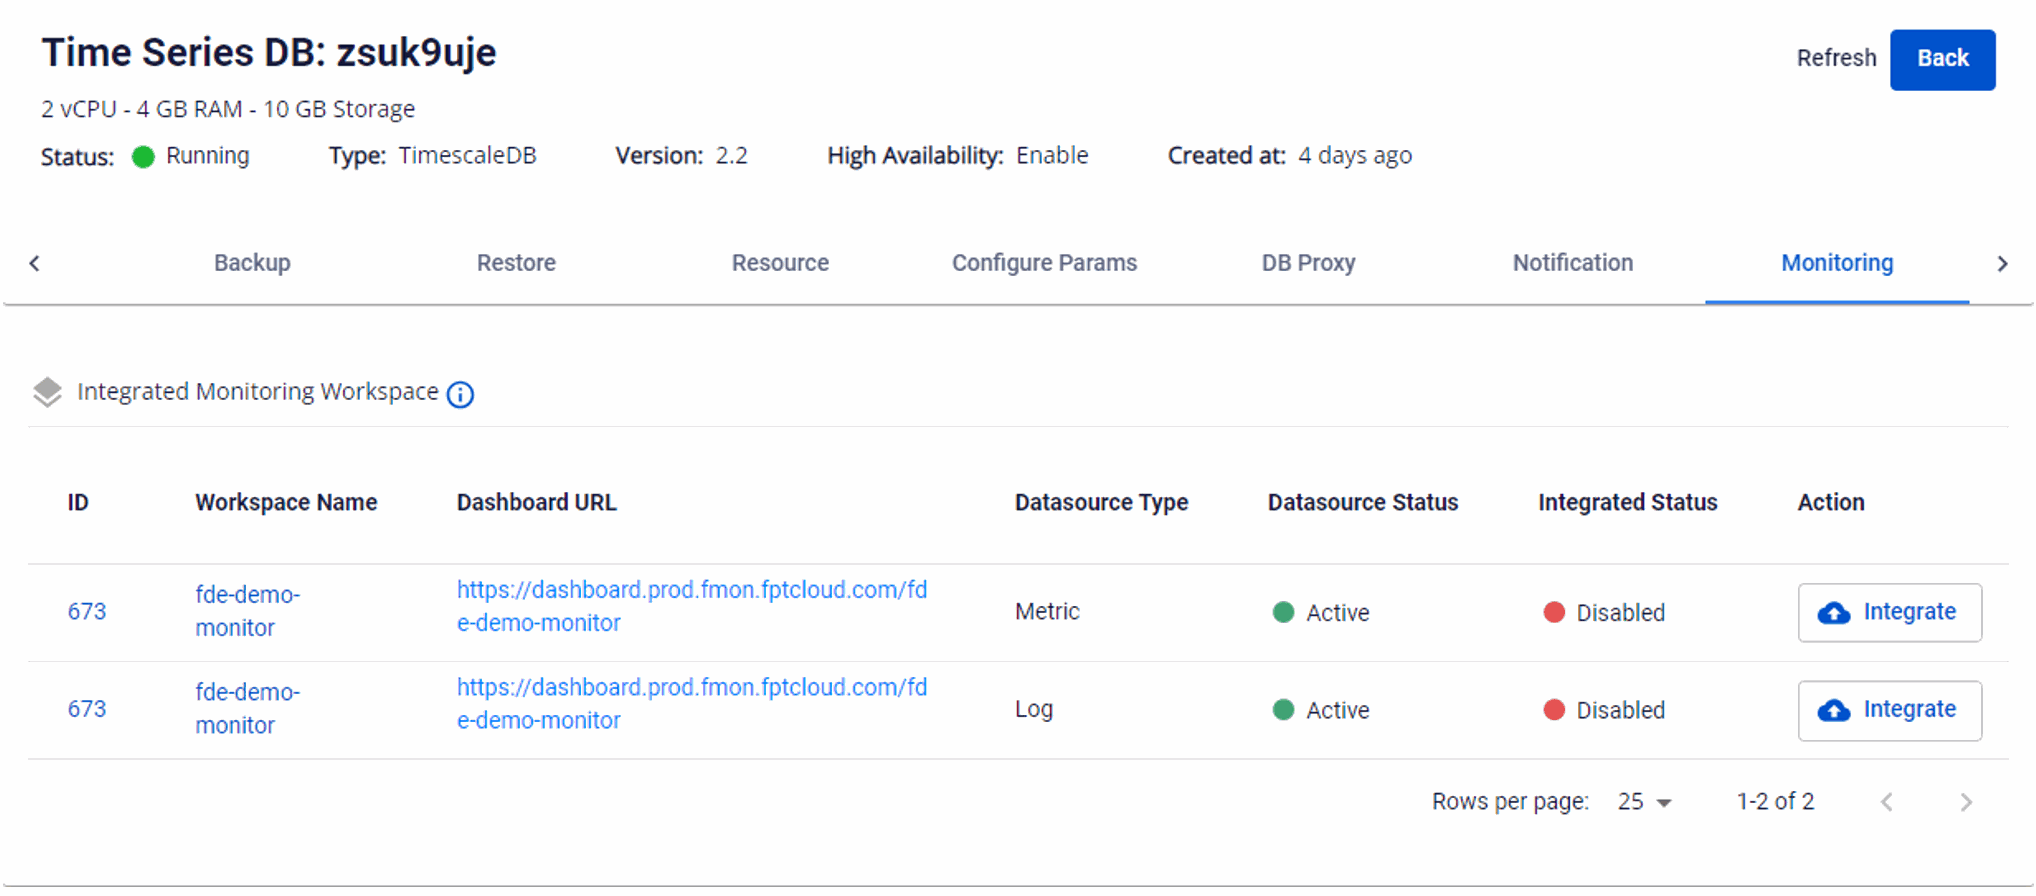
Contact FPT Support to have monitoring enabled. There is no way to turn it on yourself, so raise the request before you need the data rather than during an incident.
Integrate or disintegrate a workspace
| Action | Effect |
|---|---|
| Integrate | Starts metric and log collection for the cluster. Integrated status becomes Enabled. |
| Disintegrate | Stops collection. Integrated status becomes Disabled. |
In the workspace list, select the action for the target workspace and confirm in the dialog.
View workspace information
Once integrated, select the workspace name to open its detail page, which holds the monitoring dashboards, contact points, and datasources.
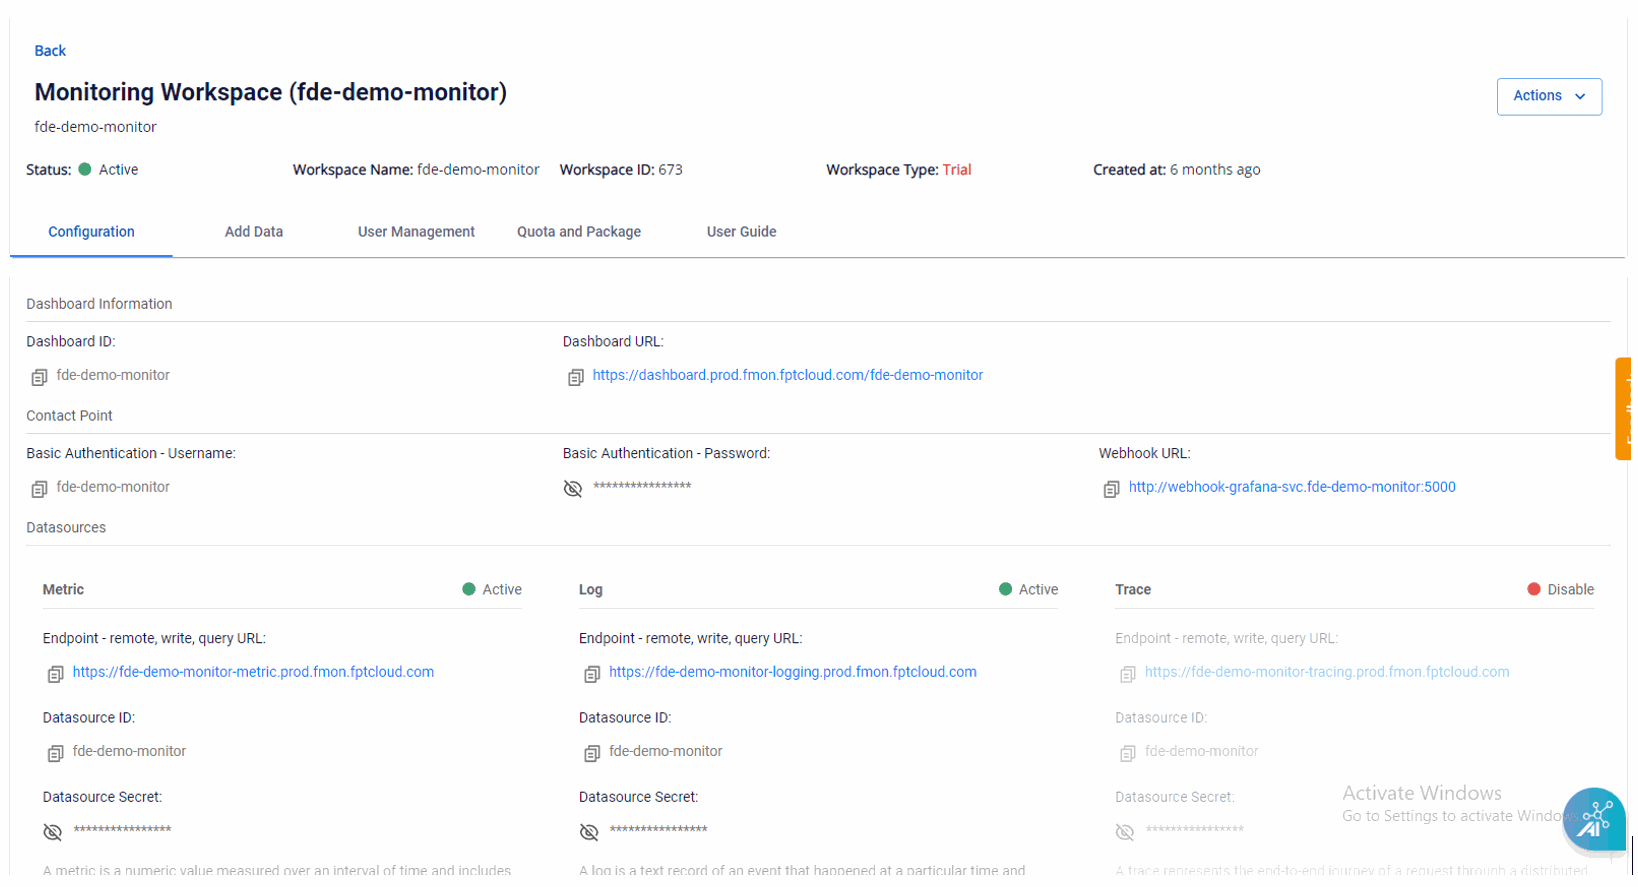
View metrics and logs in Grafana
Select the Dashboard URL from the workspace detail page to reach the Grafana sign-in page.
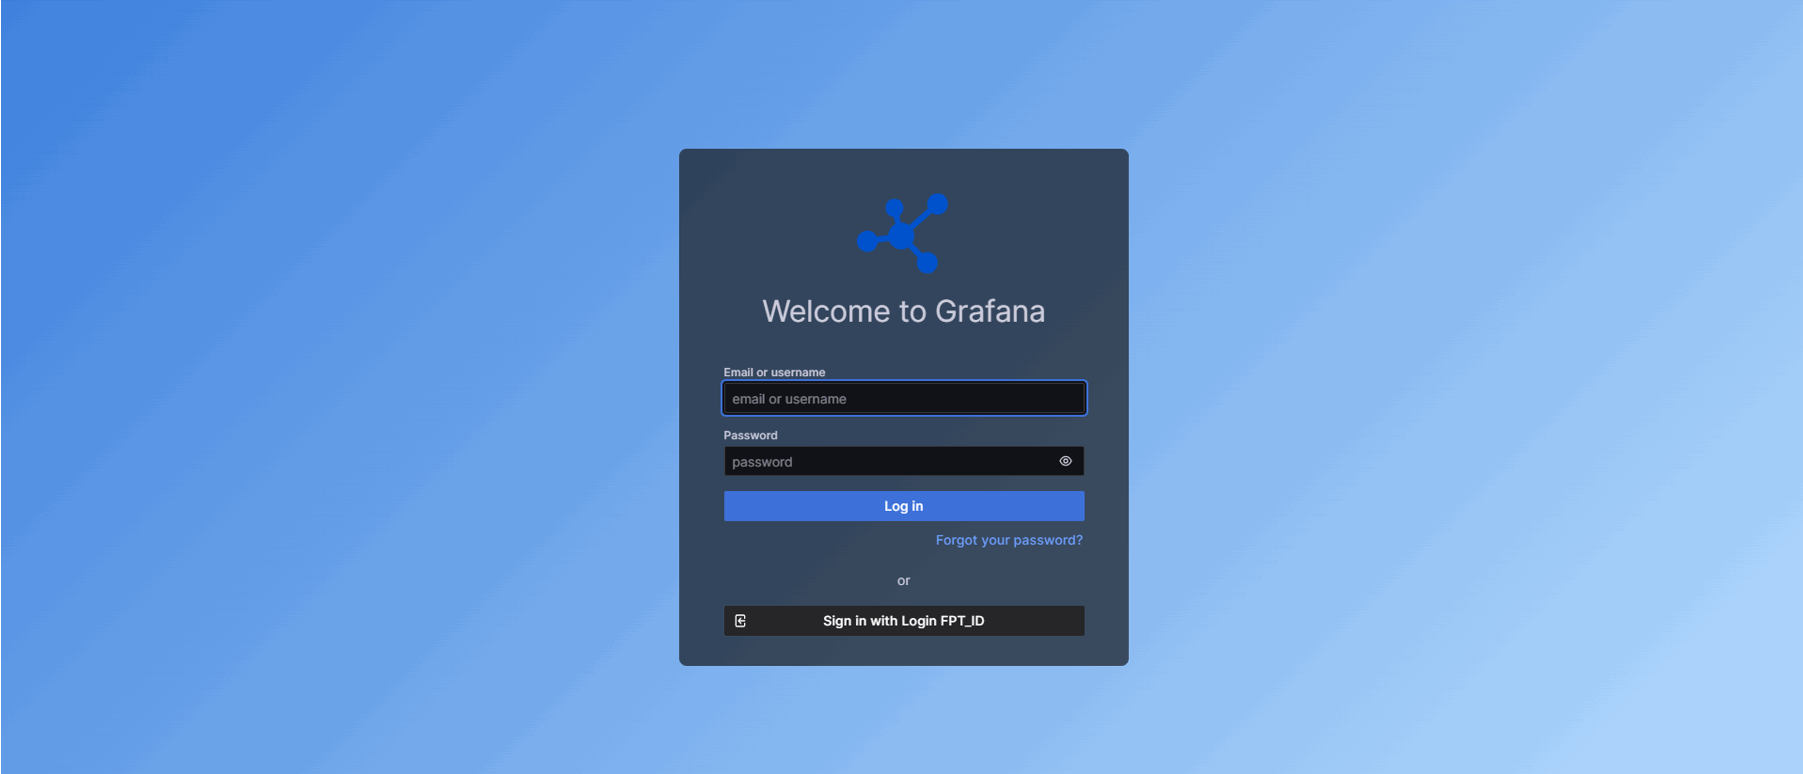
Sign in with the Basic Authentication – Username and Basic Authentication – Password shown on the workspace detail page.
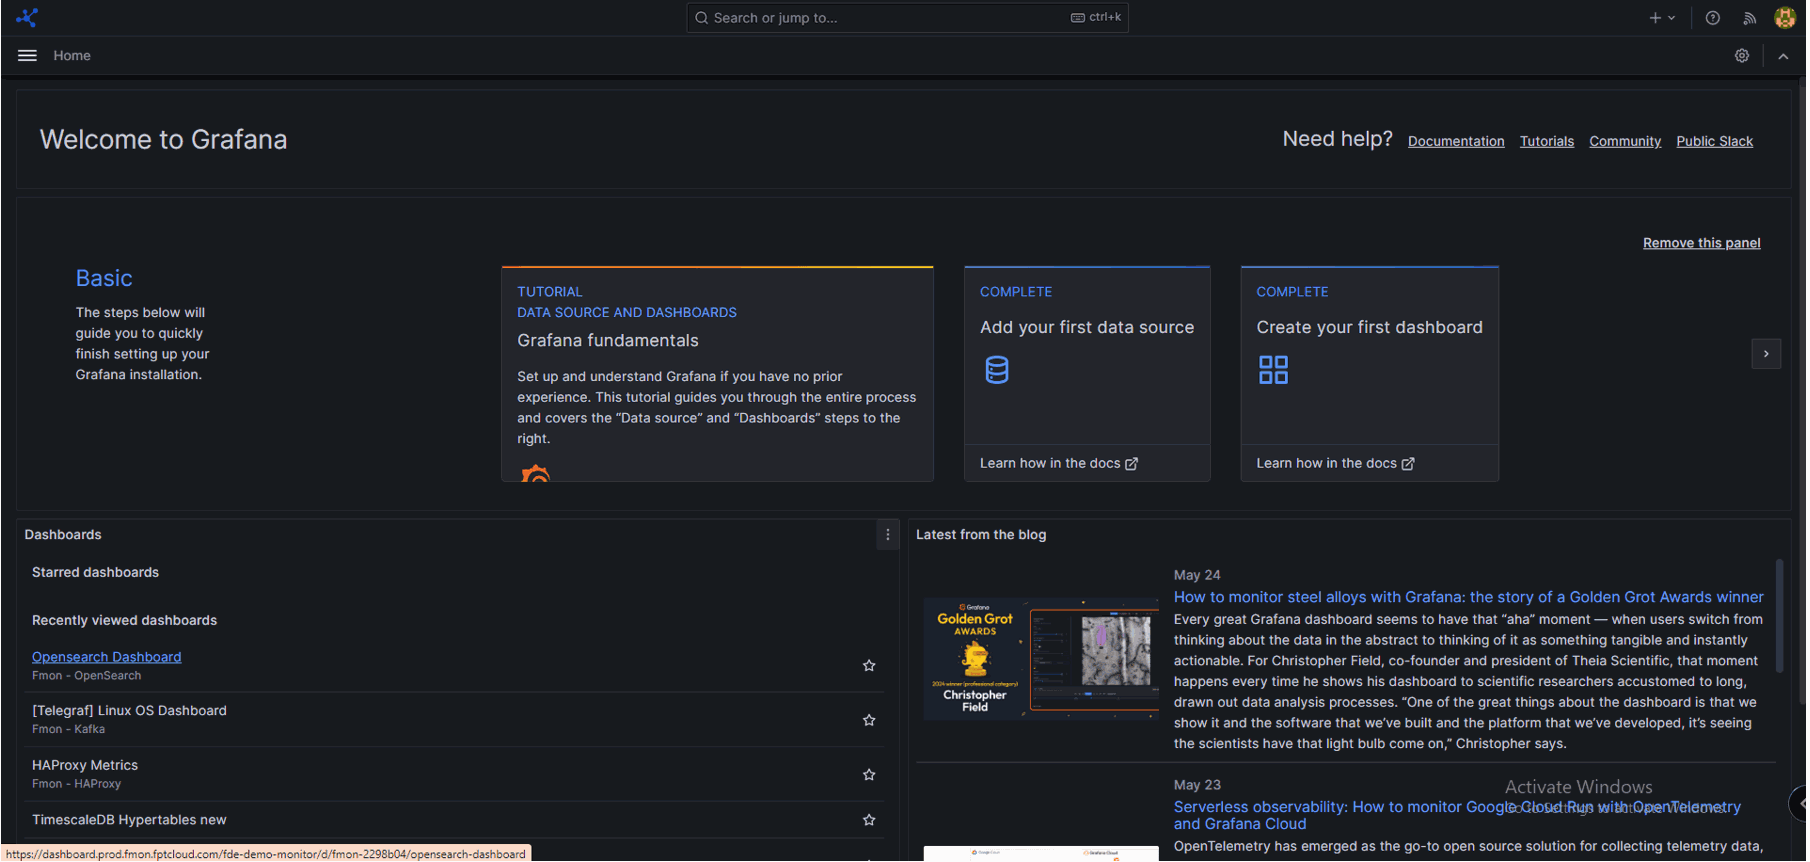
Metrics
-
Click Toggle Menu → Dashboards.
-
Select the template matching your database engine type.
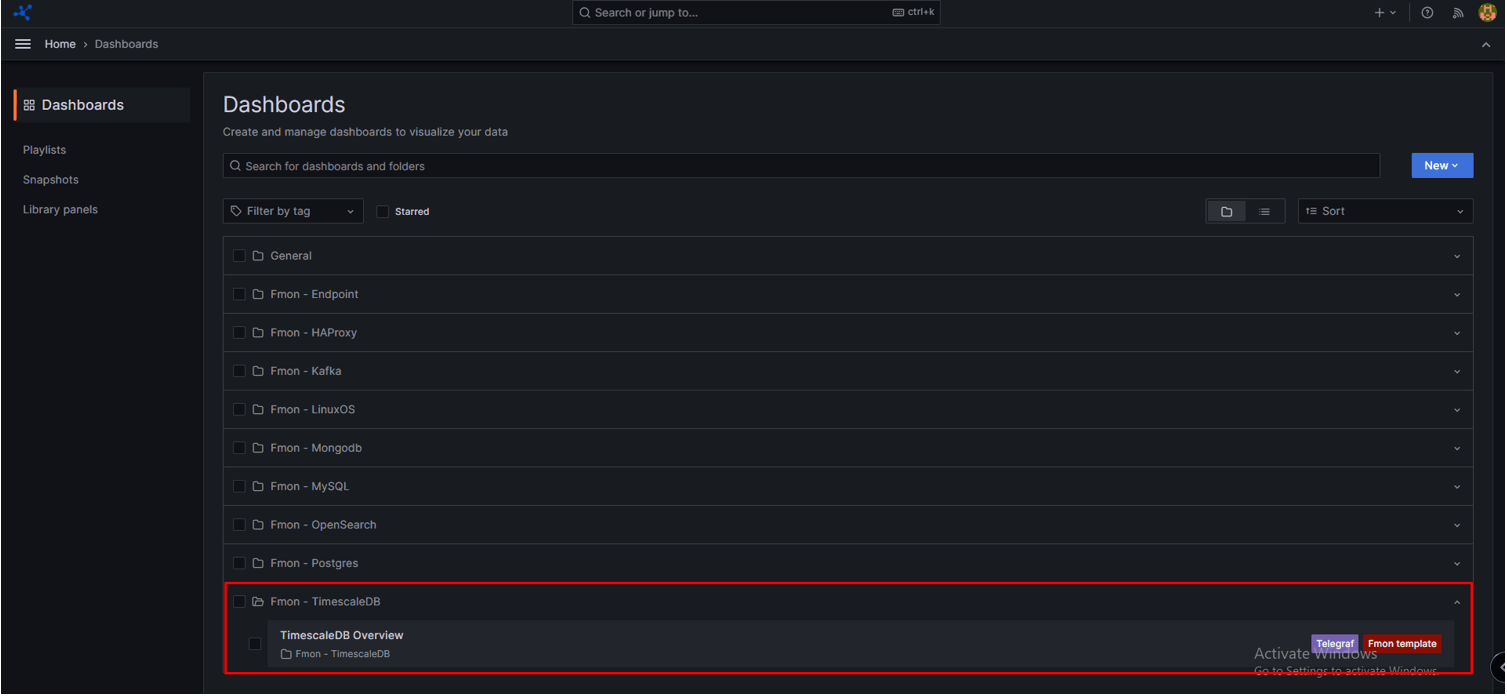
-
Select a folder to see the corresponding metrics.
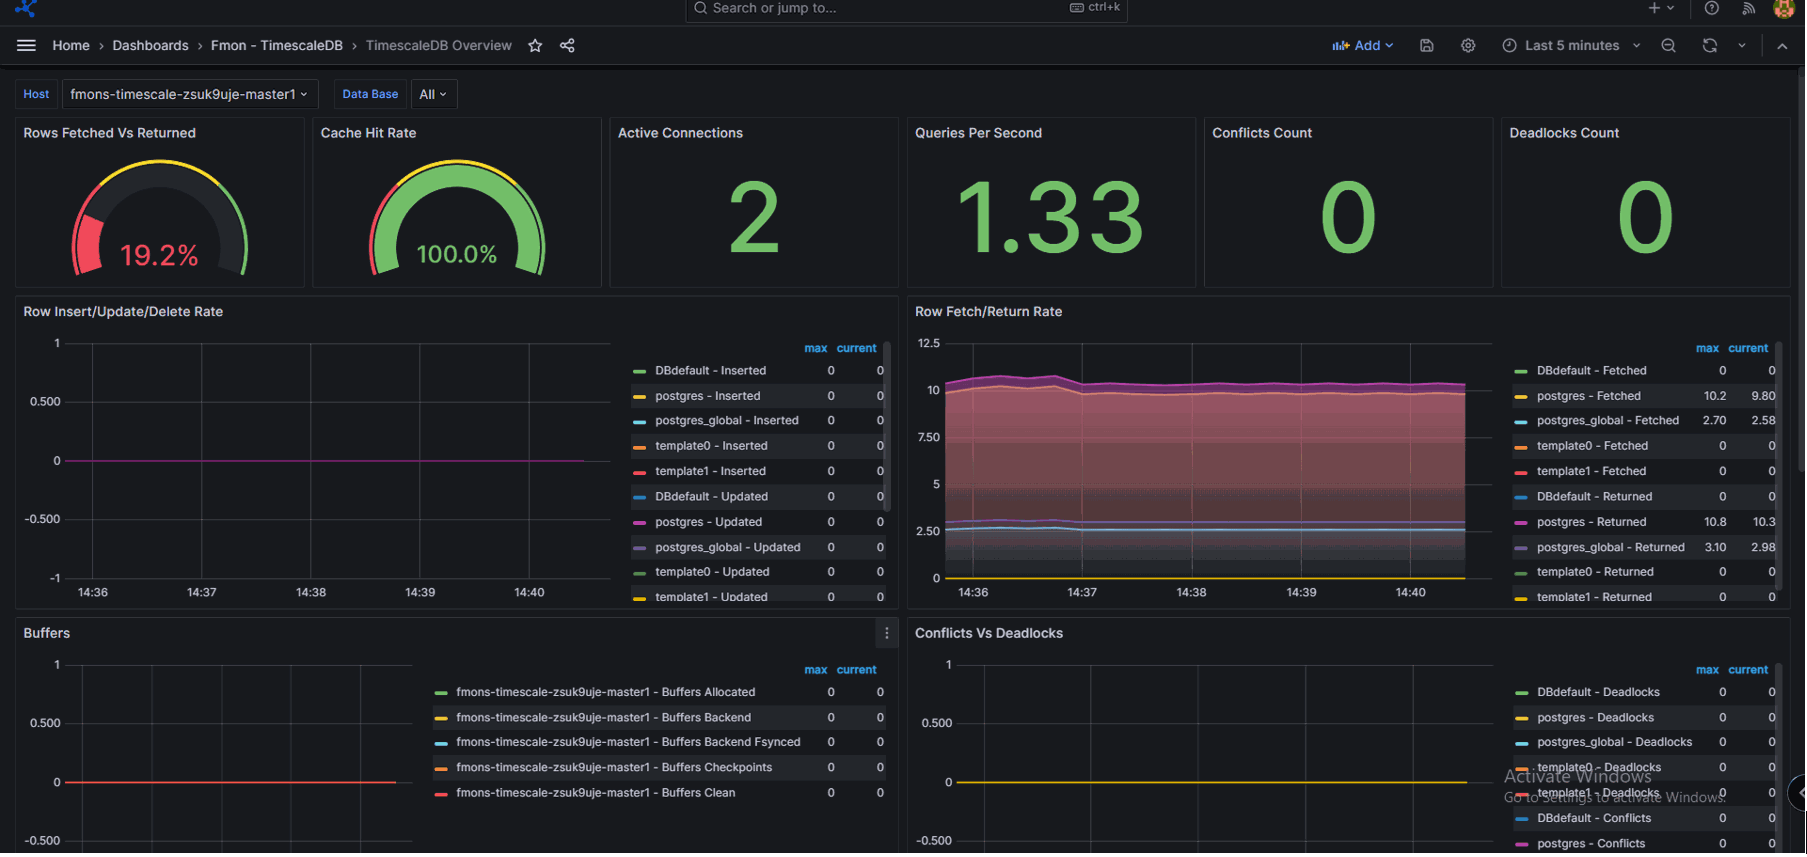
Logs
-
Click Toggle Menu → Explore.
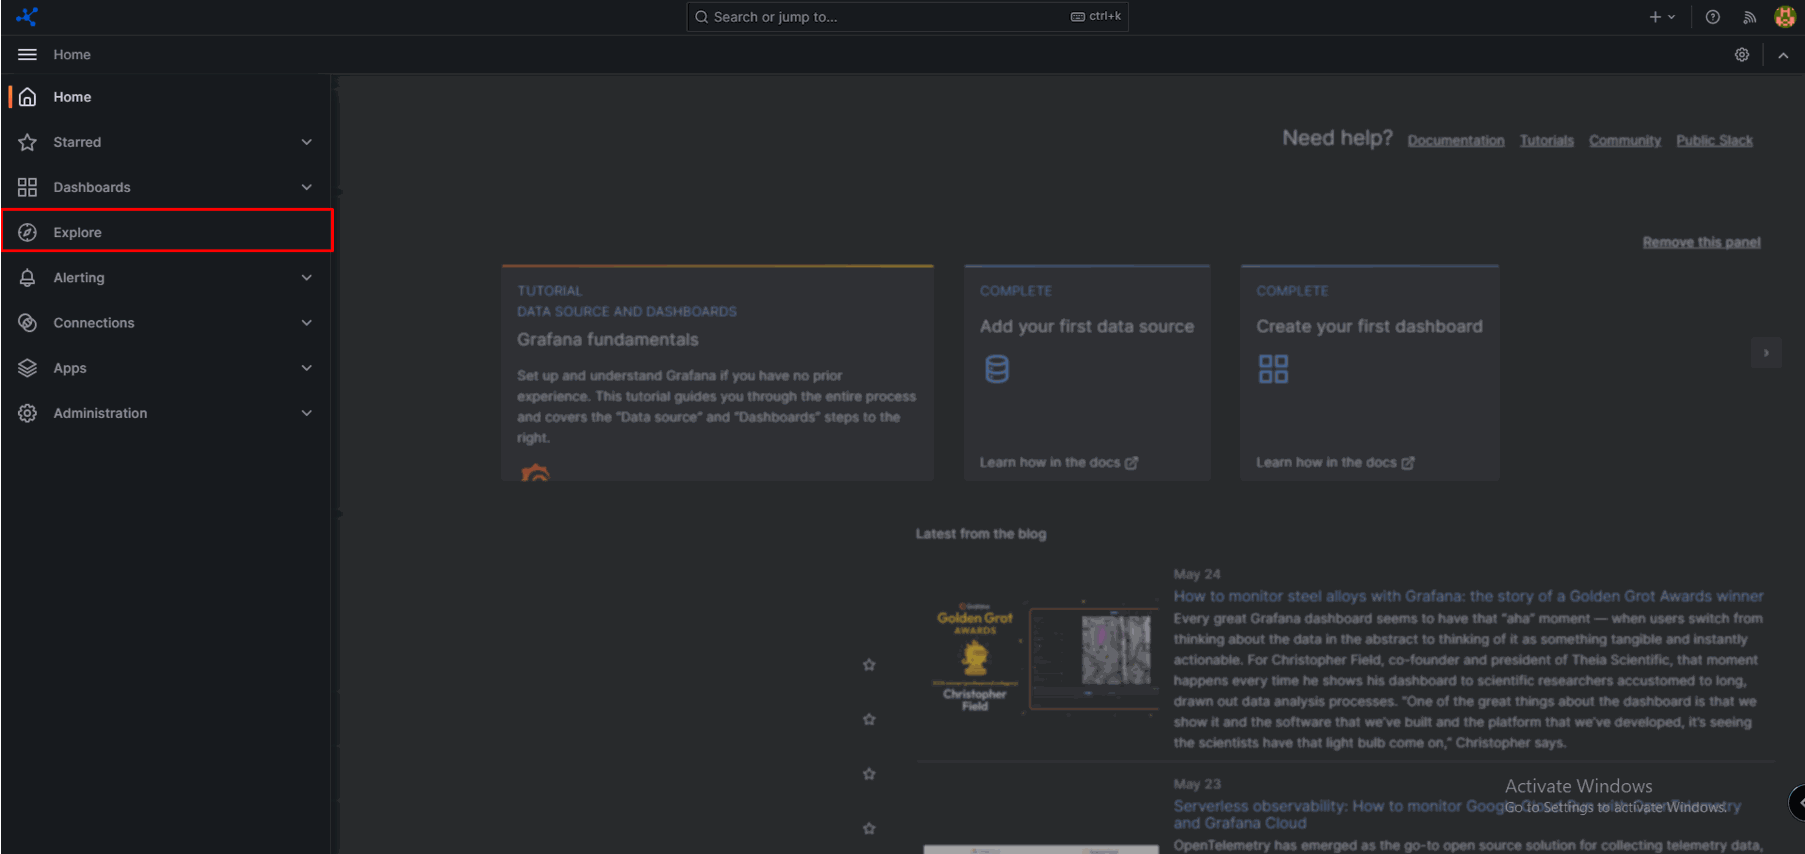
-
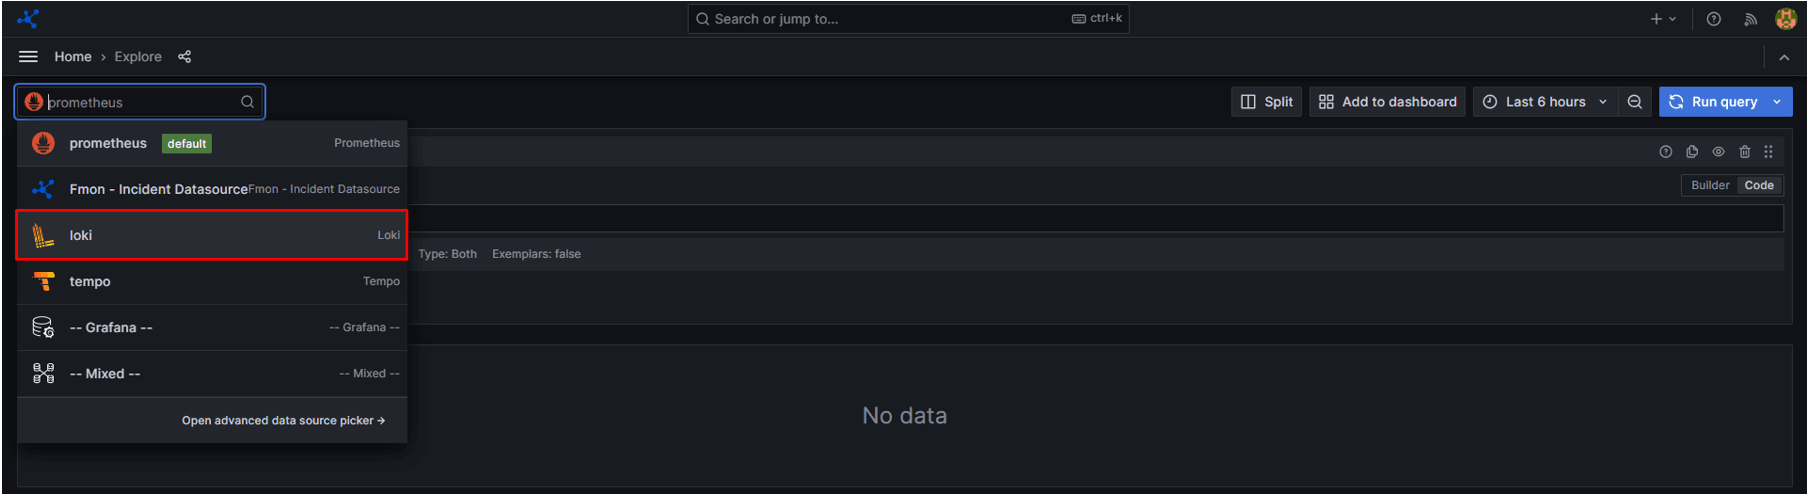
Choose Loki as the data source.
-
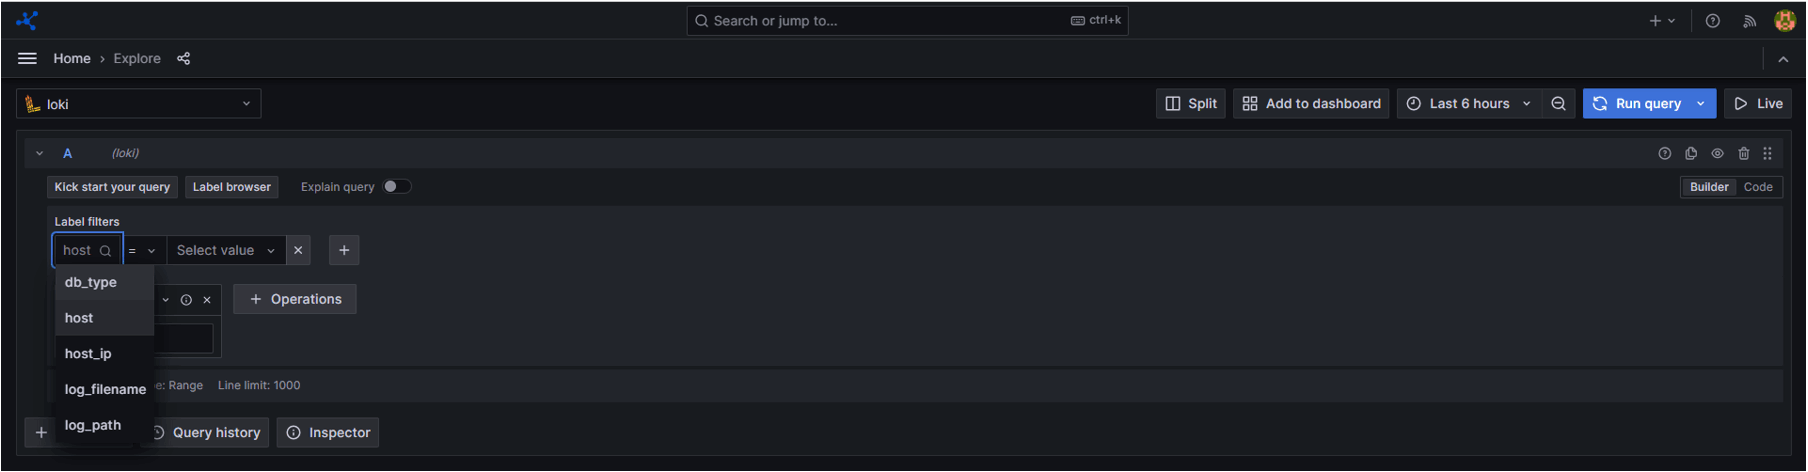
In the label filter, select the label to filter on.
-
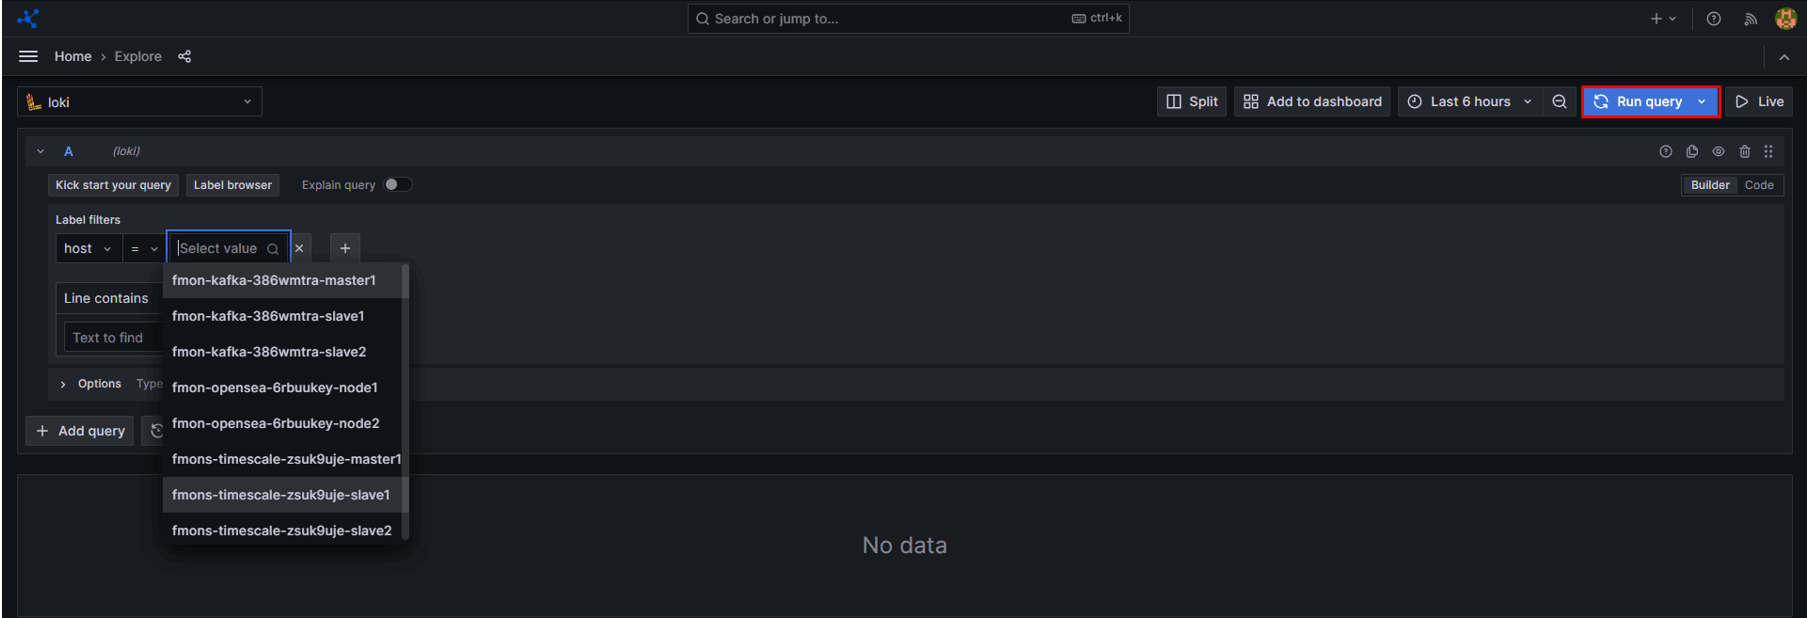
In the value filter, select the instance.
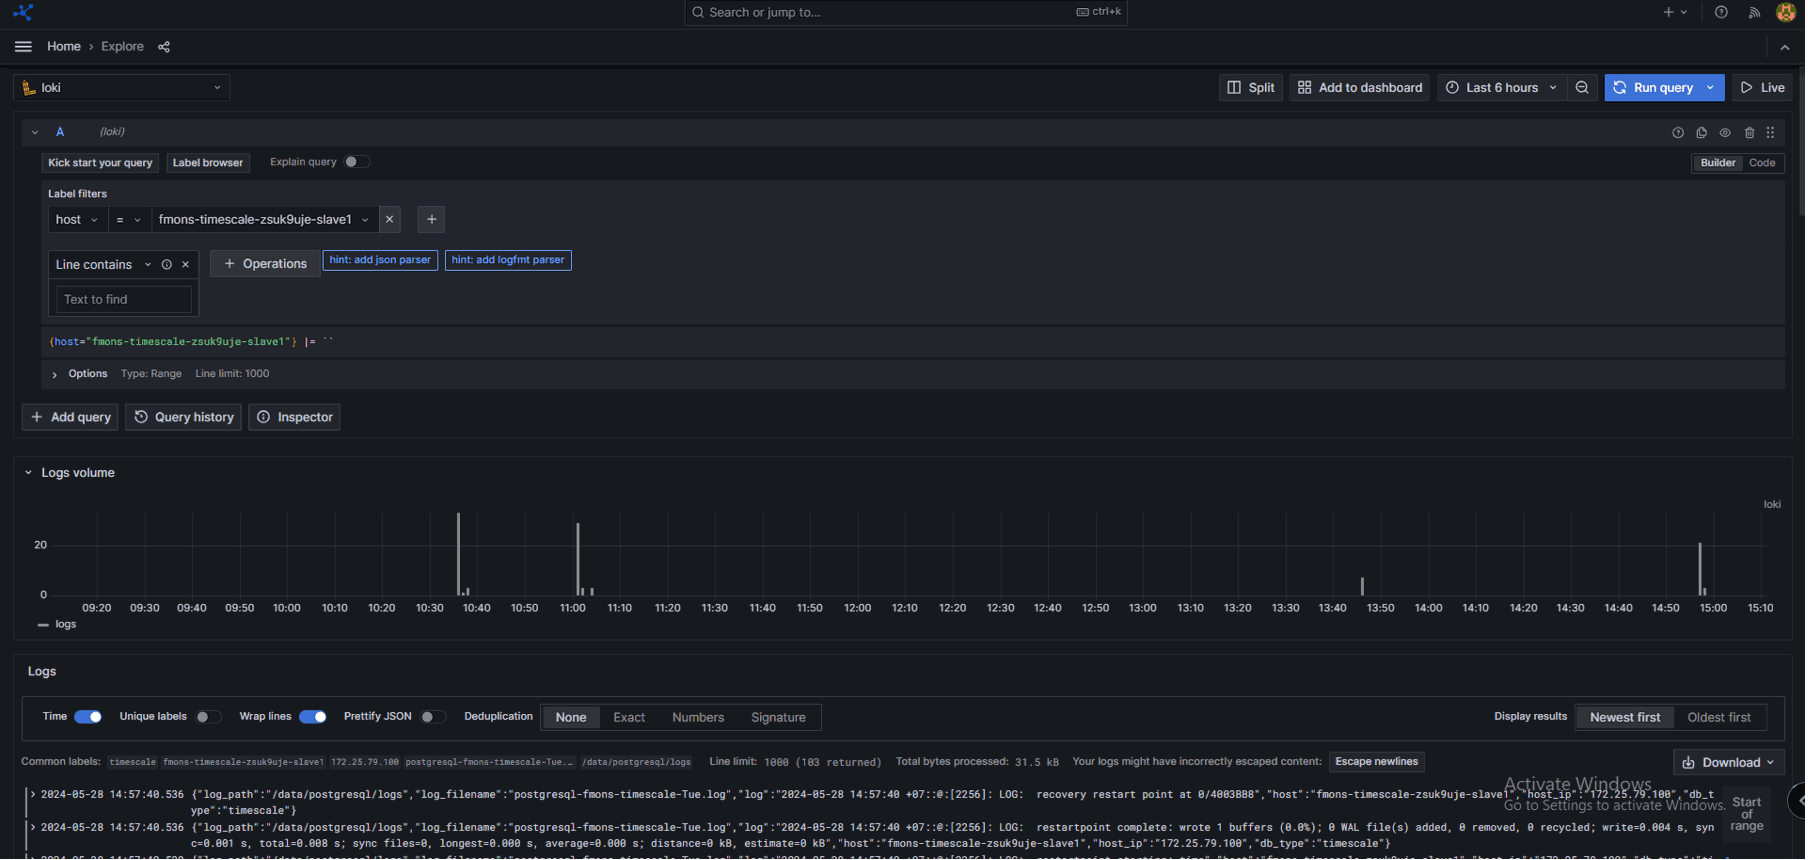
The matching logs are displayed.
Next steps
- Notification to get alerted rather than having to look
- Change database resource configurations once metrics show a bottleneck
- View action logs for operation history rather than performance metrics