View database detail
The cluster detail page collects everything you need to check the health of one cluster: its status, resource allocation, connection endpoint, enabled services, and per-node state. Open it when you are diagnosing an issue or looking up connection details.
Open the detail page
- Log in to FPT Cloud Portal.
- From the main menu, select Database Platform → All Database.
- Click the cluster ID, then open the Overview tab.
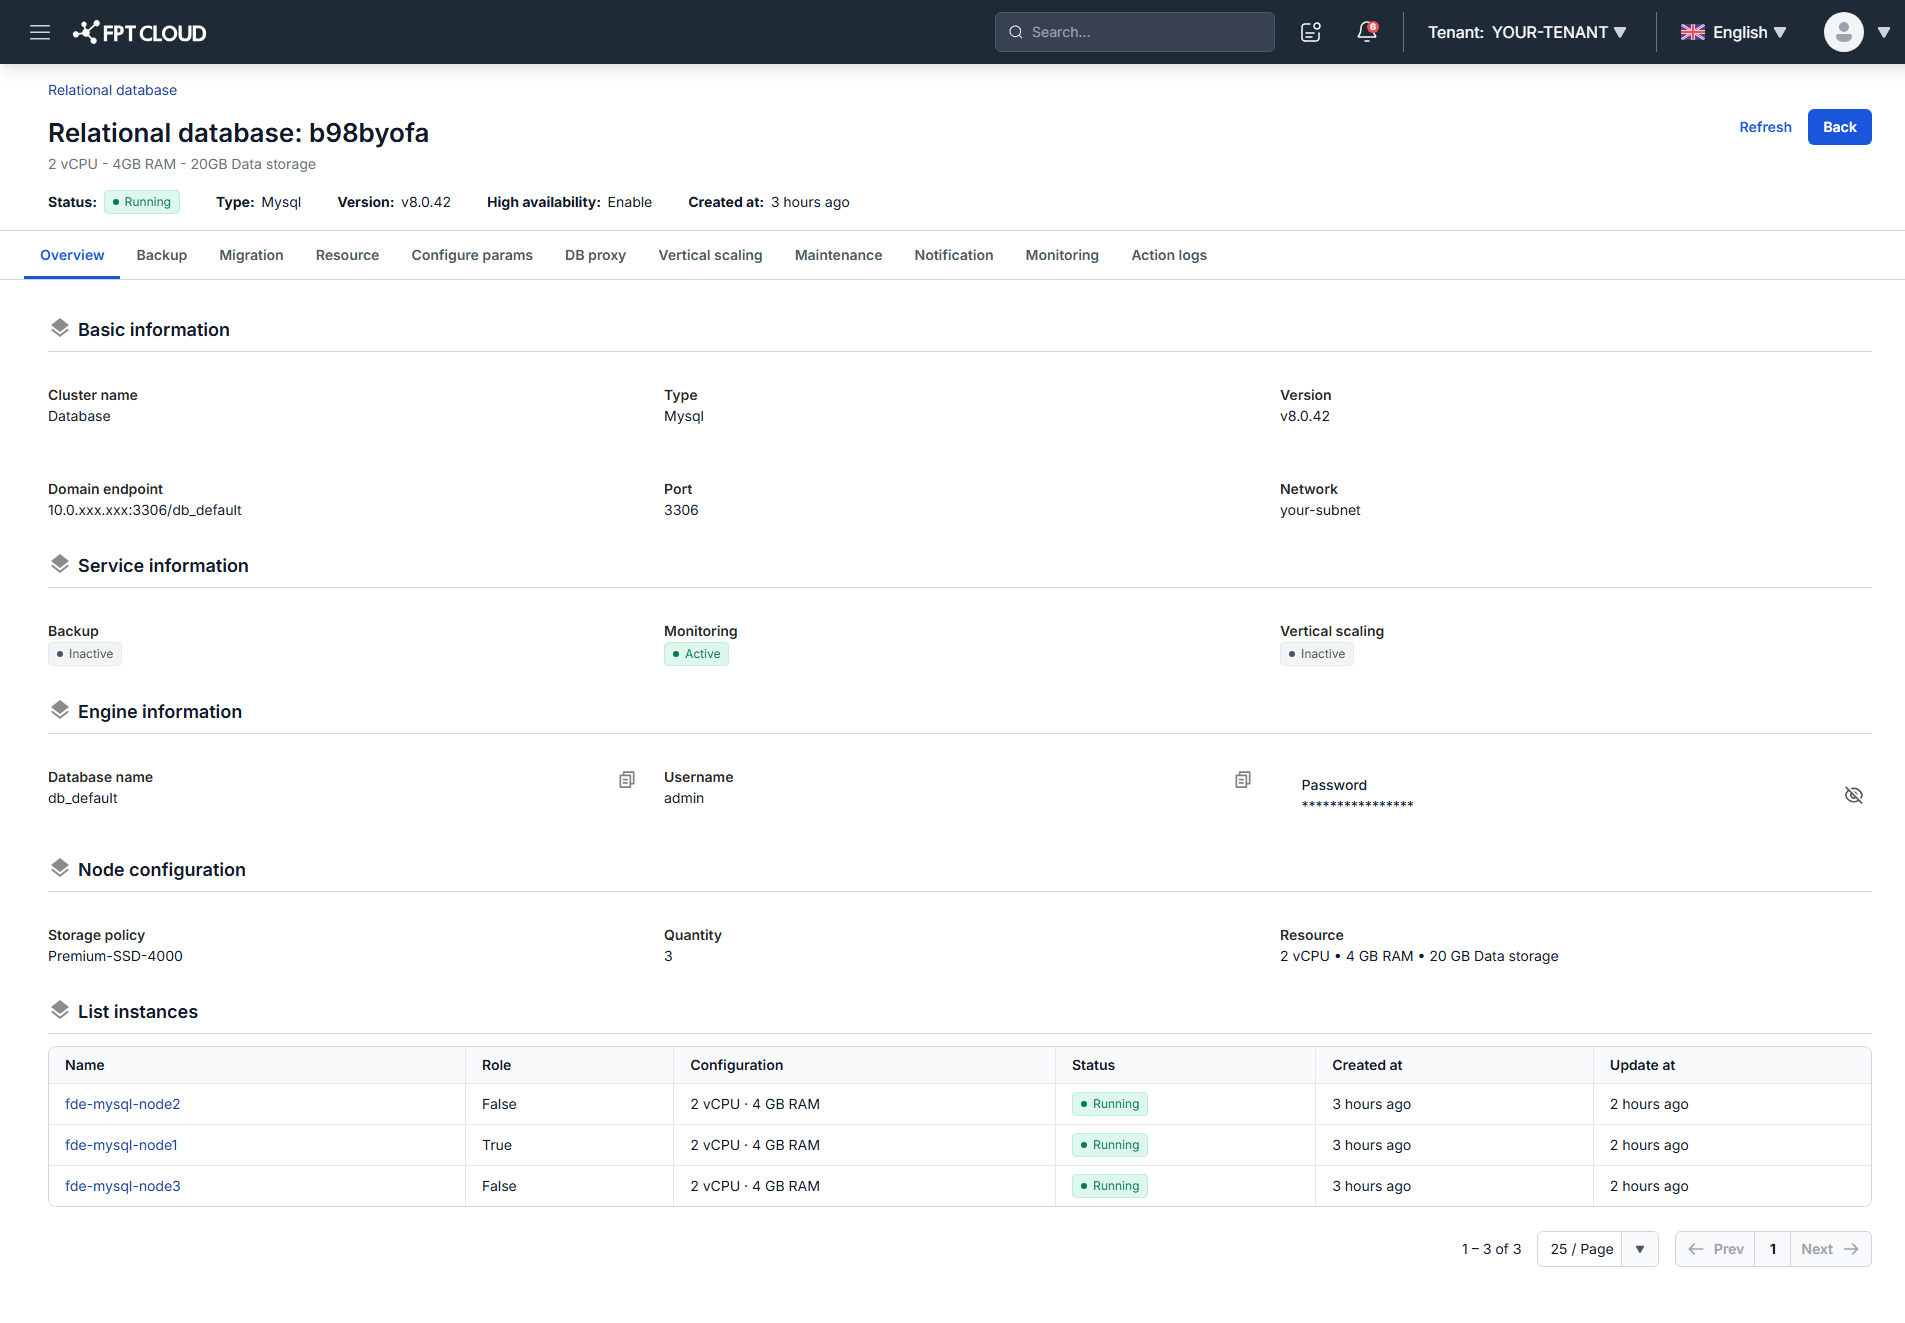
Sections on the page
| Section | What it shows |
|---|---|
| Header | Cluster ID, status such as Running or Stopped, current configuration as vCPU, RAM, and storage, engine type, engine version, and creation time. |
| Basic information | Cluster name, database type, version type, Endpoint as domain or IP, Port, and Network or Subnet. Use these to connect an application. |
| Service information | Whether Backup, Monitoring, and Vertical Scaling are enabled. |
| Engine information | The default database name and the default account credentials. |
| Node configuration | The storage policy, node count, and current per-node resources. |
| List instances | Every node in the cluster, with name, role where applicable, configuration, status, creation time, and last update time. Use this to isolate a single unhealthy node. |
Restart warning
If the cluster needs a restart, for example after you changed compute resources, the page opens with a warning dialog and shows a banner in the header.
The warning means the cluster is serving traffic on an incomplete configuration. The change you made is not in effect until the cluster restarts.
The dialog and banner disappear once the restart completes, whether you triggered it yourself or another operation triggered it.