Integrate Load Balancer with FPT Monitoring (FMON)
This feature integrates the Load Balancer with the FPT Monitoring (FMON) service, enabling you to push access logs or metrics from a Load Balancer to a Monitoring workspace for easy visualisation and analysis through Grafana — especially useful for troubleshooting issues.
Prerequisites: Your VPC must have an existing FMON monitoring workspace with sufficient quota for the storage requirements.
Step 1: Open the Load Balancer detail page for the Load Balancer you want to integrate, then click the Integration tab. A list of Monitoring workspaces available in the VPC is displayed.
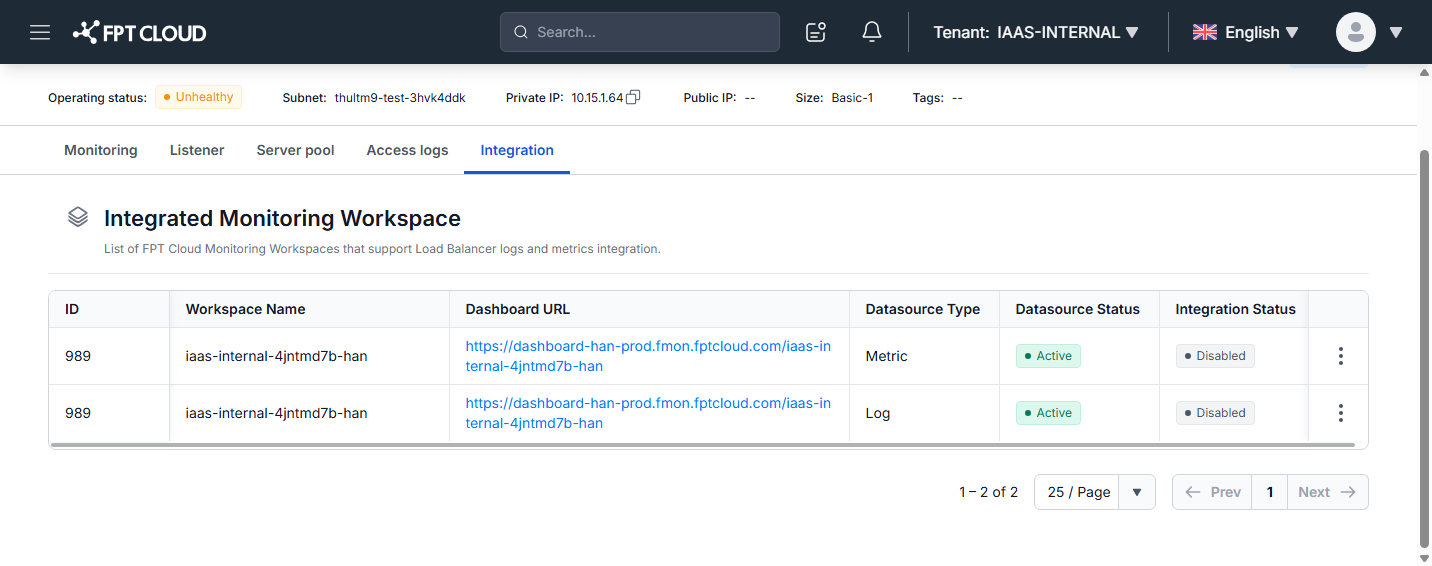
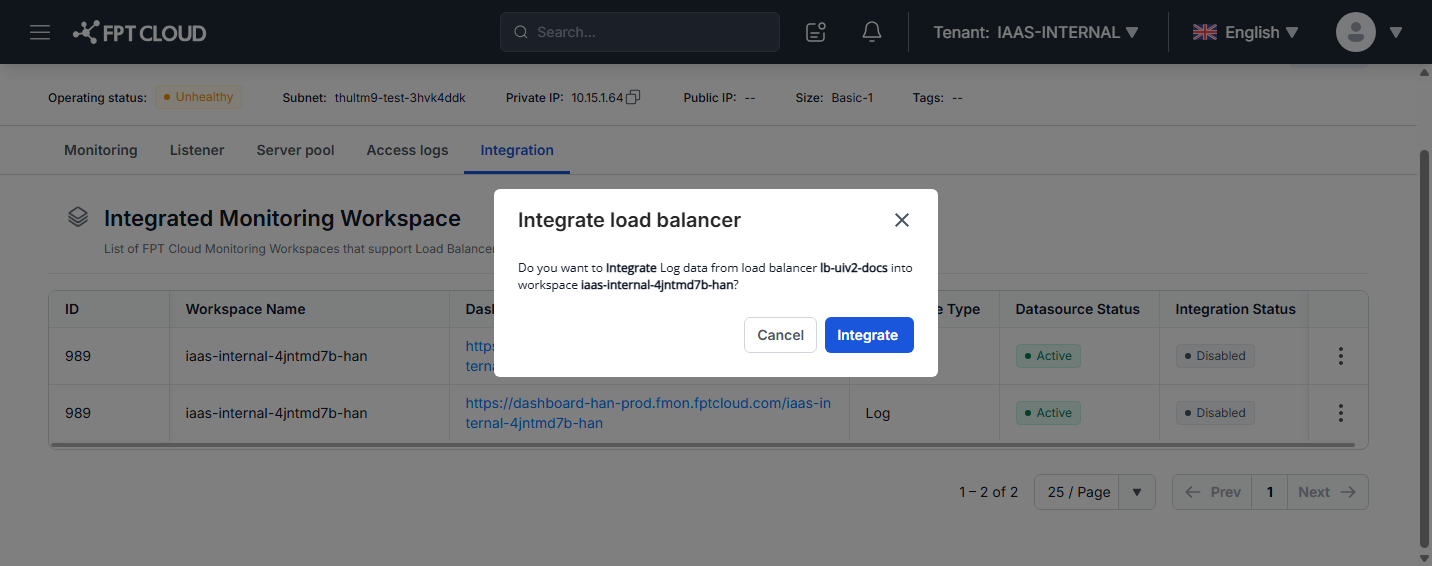
Step 2: On the workspace row you want to integrate (by Metric or Log type), open the ⋮ (row actions) menu and select Integrate. An Integrate load balancer dialog appears — click Integrate to confirm.
Step 3: After confirming, the Integration Status changes from Disabled to Integrating. Wait 1–2 minutes for it to complete; the status then changes to Integrated.
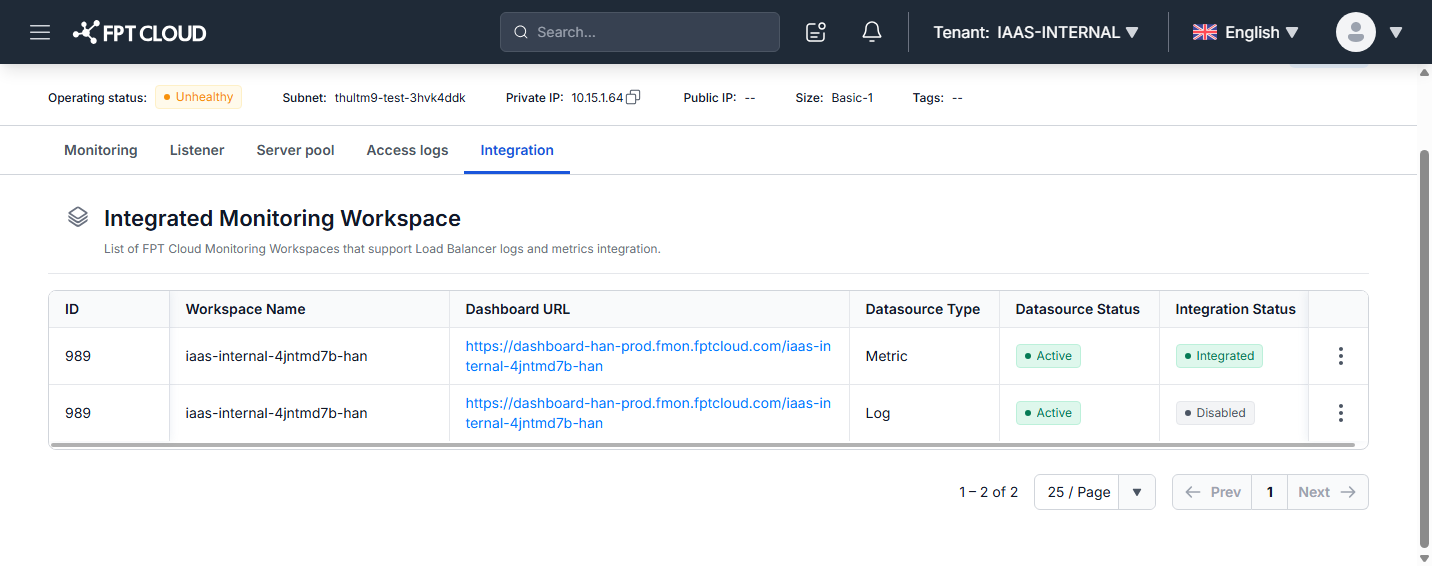
Step 4: Once integrated, you can view the Load Balancer's data directly on the portal:
- View the dashboard (metrics): Open the Load Balancer detail page and select the Monitoring tab. The embedded dashboard shows real-time metric charts for Listeners and Server Pools. See Monitor Load Balancer Charts.
- View access logs: Open the Load Balancer detail page and select the Access logs tab. See Access logs.
You can also open the FMON workspace's Grafana via the Dashboard URL (sign in with your FPT ID / SSO account) for advanced analysis or to build custom dashboards.