Monitor Load Balancer Charts
To monitor how a Load Balancer is performing, on the Load Balancer list select the one you want to view, then open the Monitoring tab on its detail page.
The Monitoring tab shows real-time charts for each Listener and Server pool of the Load Balancer.
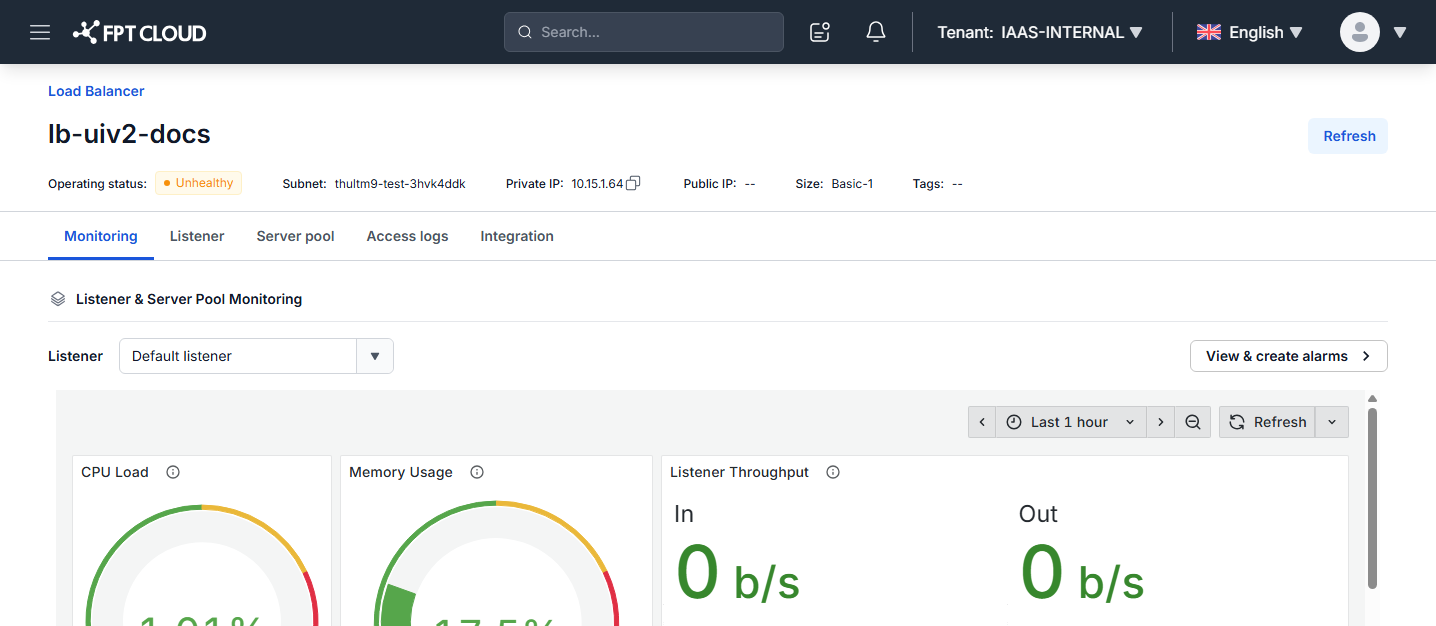
Choose what to monitor
- Listener: Select the listener you want to view in the selector at the top. The charts update to match the selected listener (and its corresponding Server pool).
- Time range: The default range is the last 1 hour (
Last 1 hour). You can change the range, move forward/backward in time, or click Refresh to reload the data. - View & create alarms: Opens the screen to view and create alarms based on the Load Balancer's monitoring metrics.
Monitoring charts
| Chart | Meaning |
|---|---|
| CPU Load / CPU Average | Current and average CPU usage of the Load Balancer. |
| Memory Usage | Memory usage ratio of the Load Balancer. |
| Listener Throughput | Inbound (In) and outbound (Out) traffic through the listener, in bytes per second (b/s). |
| Throughput In / Throughput Out | Inbound and outbound data throughput over time. |
| Network Packet/s | Network packets processed per second. |
| Network Drop Packet/s | Packets dropped per second (a sign of congestion or network errors). |
| Active Connections | Number of active connections through the listener. |
| Request/s | Number of requests processed per second. |
| Response Code | HTTP status codes returned, grouped into 2xx (success), 3xx (redirect), 4xx (client error), and 5xx (server error). Watching these groups helps you spot backend problems early, such as a rising error rate. |
| Data Transfer | Data transferred through the Server pool. |
| Active servers | Number of backend servers that are healthy. This value changes with traffic and the health check configuration. |
note
If the Load Balancer has no real traffic yet, the charts show 0. See Configure health check to ensure the Active servers status reflects the backend correctly.