Set up Load Balancer alerts with Native Alert
Native Alert helps you catch a failing Load Balancer before your end users report it. You set a threshold on a Load Balancer metric, choose where notifications go, and the system sends an alert every time the metric crosses that threshold. You no longer need to watch charts to find out that a backend went down or that traffic spiked.
Prerequisites
- At least one Load Balancer in the VPC. If you have none yet, see Overview & Initial setup.
- Access to the Monitoring section of the FPT Cloud Portal.
- A channel chosen for receiving alerts: Email, Slack, Teams, or Telegram.
Native Alert builds its resource lists per VPC. A VPC with no Load Balancer does not offer Load Balancer in the Type field, and Apply To then holds only All load balancers.
Create a recipient to receive alerts
A recipient is an address that receives alerts. Create the recipient first, because the Notify to field on the alert form only accepts recipients that already exist.
- Select Monitoring → Native Alert, then open the Recipient tab.
- Click Create Recipient.
- Enter a Name. The name accepts only letters, numbers, underscores, hyphens, spaces, and dots.
- Select a Method and fill in the matching field described in the table below.
- Turn on Project-level recipient to use this recipient across every VPC in the project. Leave it off to keep it inside the current VPC.
- Click Create.
The new recipient appears in the Recipient tab with a Level of Project or VPC.
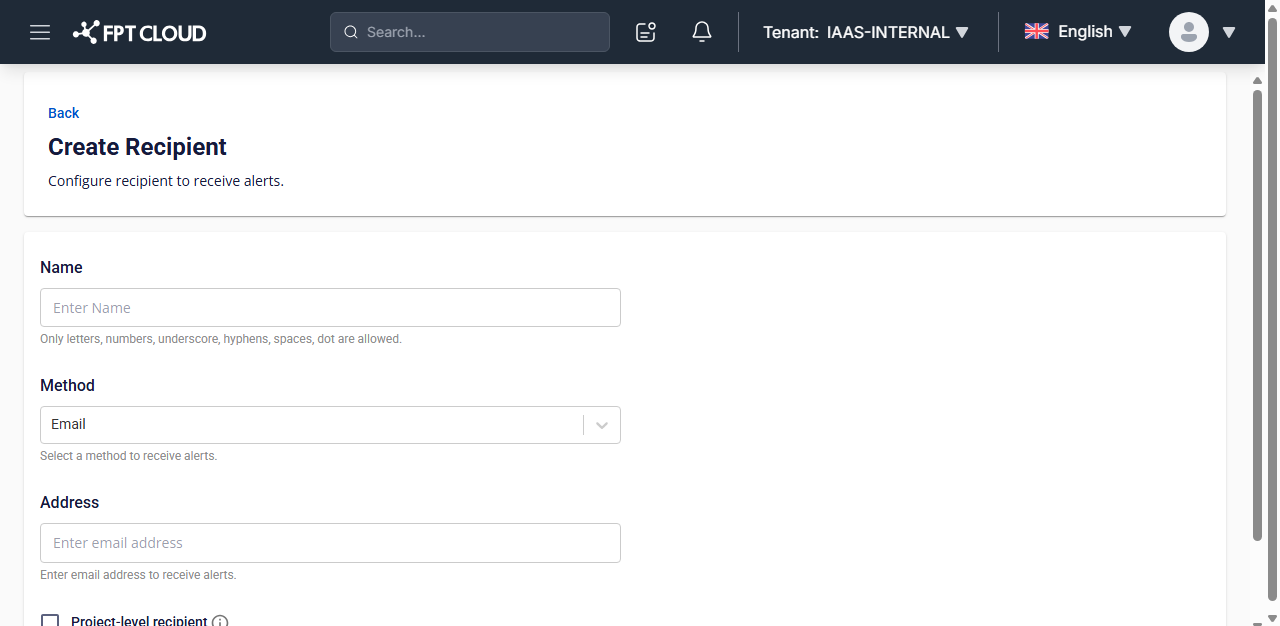
Four channels are supported:
| Method | Field to fill | How it is verified |
|---|---|---|
| Address — the email address that receives alerts | No extra verification | |
| Slack | Slack Channel | Click the Here link to sign in to your Slack workspace first, then pick the channel |
| Teams | Webhook URL | Click Send test message to check the webhook before saving |
| Telegram | Telegram ID | Click the Here link to get the chat ID, then click Send Verification Link |
Slack and Telegram require their verification step before you save. For Slack, the Slack Channel field stays locked until you sign in to the workspace. For Telegram, an unverified recipient receives no alerts.
Create an alert for a Load Balancer
There are three ways into the alert form:
- From the Monitoring menu — select Monitoring → Native Alert, open the Resource alert tab, then click Create alarm.
- From the Load Balancer page — select Load Balancer → Load Balancer, open the Load Balancer you want to watch, go to the Monitoring tab, then click View & create alarms.
- While creating the Load Balancer — the wizard has a Recommended alarm step that proposes two overload alarms and lets you pick a recipient there. See Create a Load Balancer.
View & create alarms opens the Native Alert page in a new tab and does not pre-select the Load Balancer you were viewing. You still have to choose it in the Apply To field.
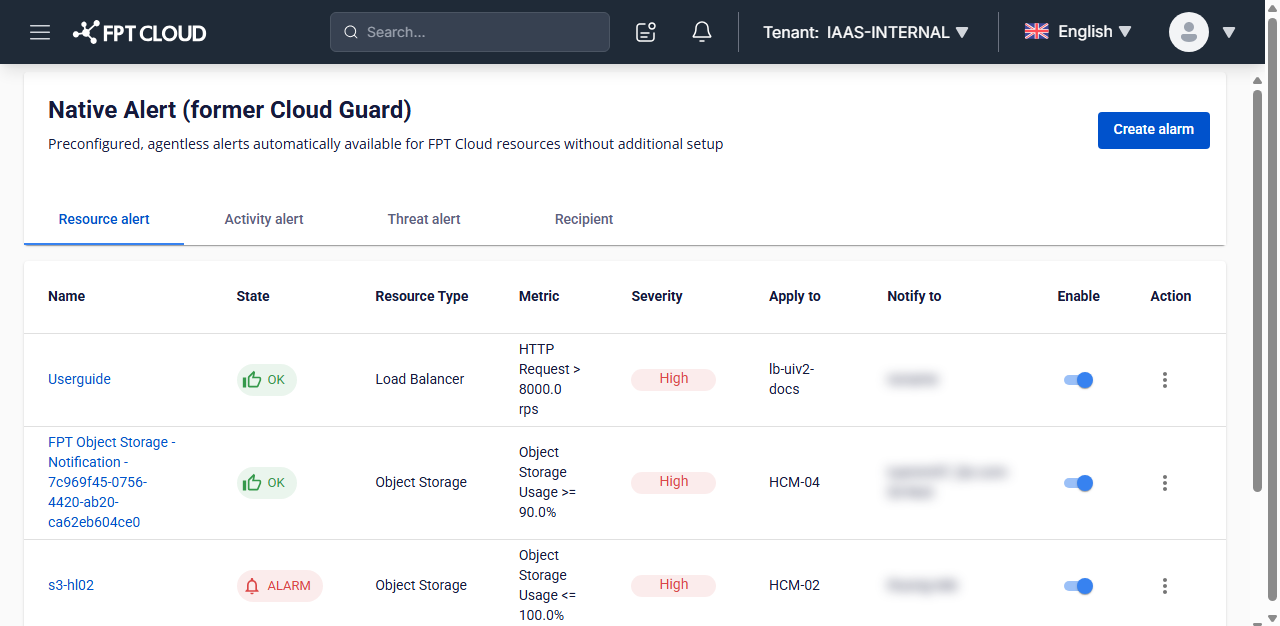
Once the Create Alert screen is open:
- Enter a Name for the alert. The same character rules as the recipient name apply.
- Set Type to Load Balancer.
- Configure the condition under Configure condition using the table below.
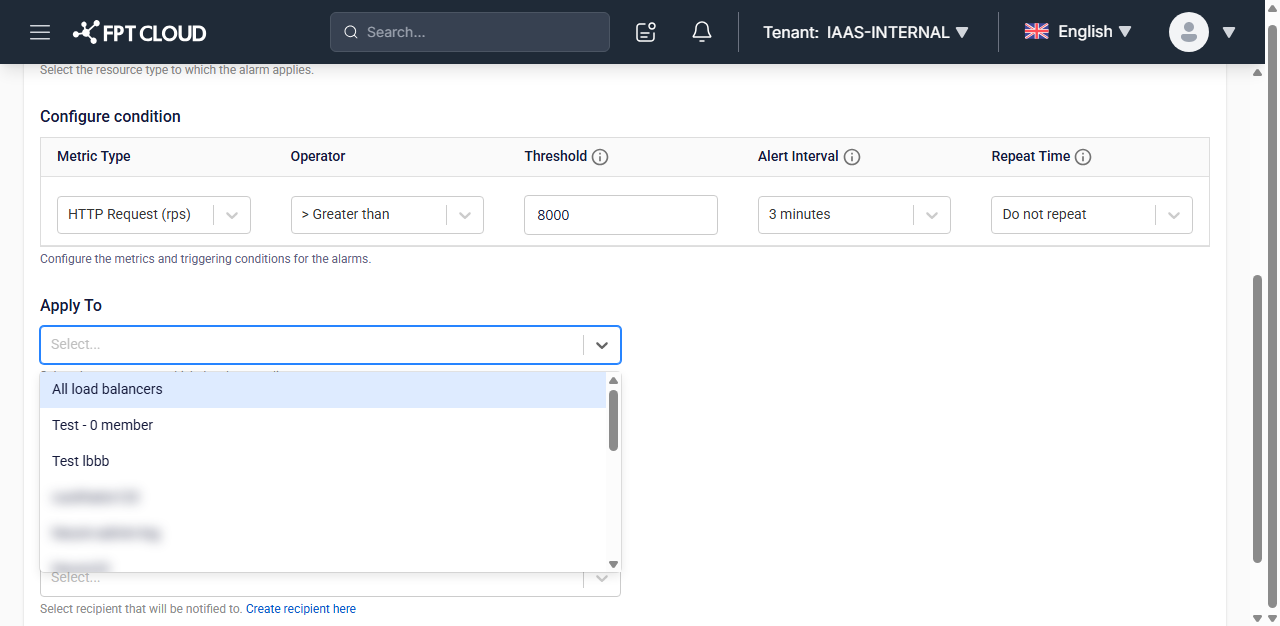
- Choose the Load Balancers to watch under Apply To. Pick
All load balancersto cover every Load Balancer in the VPC, or select individual ones by name. - Set Severity to
Critical,High,Medium, orLow. - Select a recipient under Notify to.
- Click Create.
The new alert appears at the top of the Resource alert tab with Enable already on and State set to OK.
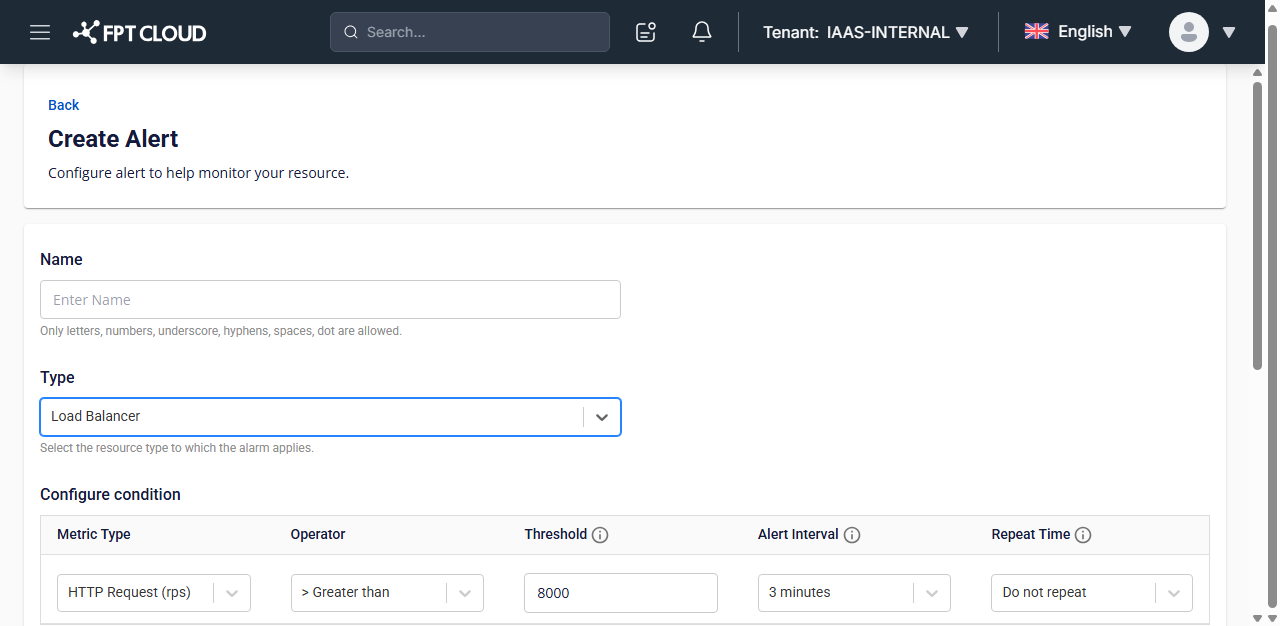
The fields under Configure condition:
| Field | Description |
|---|---|
| Metric type | The Load Balancer metric to alert on, listed in the metric table below |
| Operator | The comparison: < (Lower than), <= (Lower than/Equal to), > (Greater than), >= (Greater than/Equal to) |
| Threshold | The threshold value. The system notifies you when the metric reaches it |
| Alert interval | How often the system re-evaluates the metric: 3 minutes, 5 minutes, 30 minutes, 1 hour, 6 hours, 1 day |
| Repeat time | How often the alert repeats while the metric stays over the threshold: Do not repeat, 15 minutes, 30 minutes, 1 hour, 6 hours, 1 day |
Apply To and Notify to both accept multiple values and both have a search box. In a VPC with many Load Balancers, type part of a name to filter instead of scrolling the list.
Load Balancer metrics
Native Alert supports thresholds on these 13 metrics:
| No. | Metric | Unit | Description |
|---|---|---|---|
| 1 | HTTP Request | request/s | Number of requests per second reaching the Load Balancer |
| 2 | HTTP code status (1xx) | request/s | Number of 1xx HTTP response codes per second from the Load Balancer |
| 3 | HTTP code status (2xx) | request/s | Number of 2xx HTTP response codes per second from the Load Balancer |
| 4 | HTTP code status (3xx) | request/s | Number of 3xx HTTP response codes per second from the Load Balancer |
| 5 | HTTP code status (4xx) | request/s | Number of 4xx HTTP response codes per second from the Load Balancer |
| 6 | HTTP code status (5xx) | request/s | Number of 5xx HTTP response codes per second from the Load Balancer |
| 7 | Active connection | connection | Number of connections open to the Load Balancer. A single connection can carry many requests |
| 8 | Percentage of backend down | % | Percentage of backends that are down (unhealthy) |
| 9 | Number of backends down | number of backends | Count of backends that are down (unhealthy) |
| 10 | Total packet In/Out per second | packet/s | Total packets the Load Balancer handles in the In or Out direction. Use it to read real load through the Load Balancer and spot unusual traffic increases |
| 11 | Drop packet In/Out per second | packet/s | Total packets per second dropped while passing through the Load Balancer. Use it to detect connection interruptions or an overloaded Load Balancer |
| 12 | Provisioning status Pending | N/A | Alerts when the Load Balancer Provisioning status is Pending, meaning it is being created, updated, or reconfigured |
| 13 | Operating status Unhealthy | N/A | Alerts when the Load Balancer Operating status is Unhealthy |
Metrics 12 and 13 map to the Provisioning status and Operating status columns on the Load Balancer list page. Turn these two on first, because they report a Load Balancer that stopped working rather than one that is merely busy.
Check and track your alerts
The Resource alert tab lists every alert in the VPC with its current state.
| Column | Meaning |
|---|---|
| State | OK while the metric stays within the threshold, ALARM while it is over |
| Metric | The configured condition, for example HTTP Request > 8000.0 rps |
| Apply to | The Load Balancers the alert covers |
| Notify to | The recipients that get notified |
| Enable | Turns the alert on or off directly in the list, without reopening the configuration |
To see when an alert fired, click the three-dot icon in the Action column and select View History.
Each history row records when the state changed, the old state, the new state, the resource name, and the reason. The Reason column gives the measured value and the evaluation window, for example a value of 29.73 over the last 3m. A newly created alert has no rows until its state changes for the first time.
Edit or delete an alert
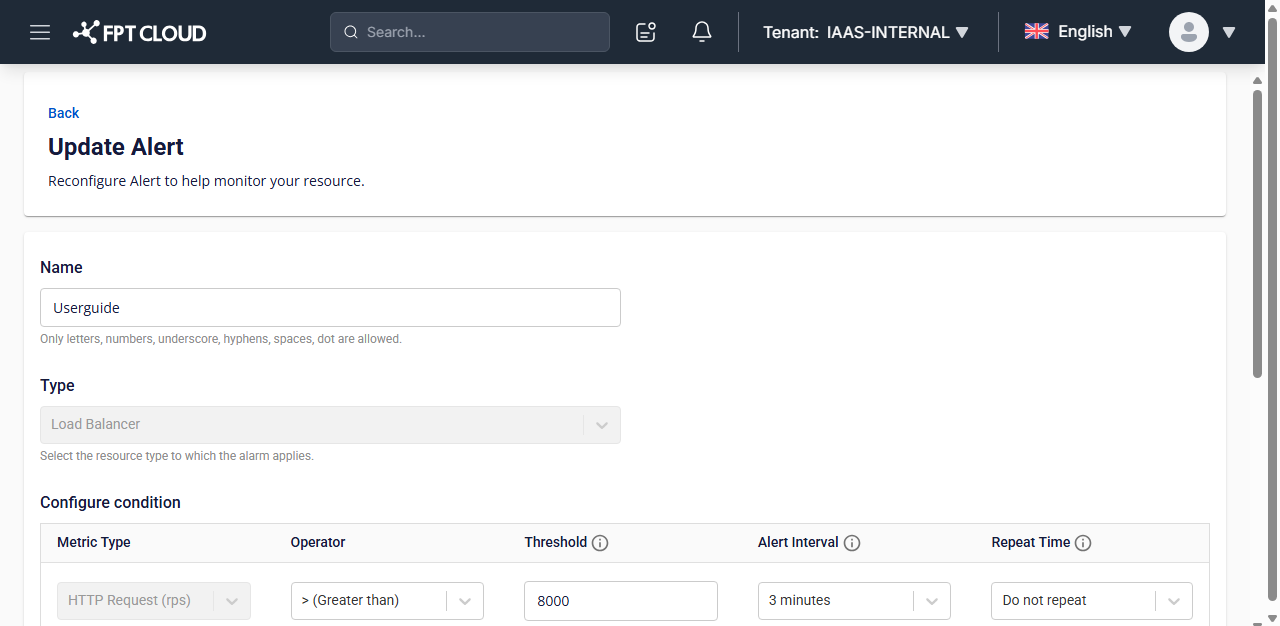
To edit, click the alert name in the Name column to open the Update Alert screen, change the values, then click Update.
The Action menu has no edit entry. Clicking the alert name is the way into the Update Alert screen.
On the Update Alert screen:
- Editable: Name, Operator, Threshold, Alert interval, Repeat time, Apply To, Severity, Notify to.
- Locked: Type and Metric type. Both appear dimmed.
To change the resource type or the metric, delete the alert and create a new one.
To delete, click the three-dot icon in the Action column and select Delete.
Deleting an alert cannot be undone, and its alert history goes with it. To pause notifications instead, turn off the Enable toggle rather than deleting.
Next steps
- Monitor Load Balancer charts — read metrics in real time to pick a sensible threshold.
- Configure health check — decide when a backend counts as down.