Dashboard
The FPT AppSec Dashboard provides a centralized view of security metrics across your organization — scan results, issue statistics, and asset information aggregated from all teams.
All charts and metrics use data from the most recent successful scan. Click Refresh to reload. If there is no data, a dash ("-") is displayed by default.
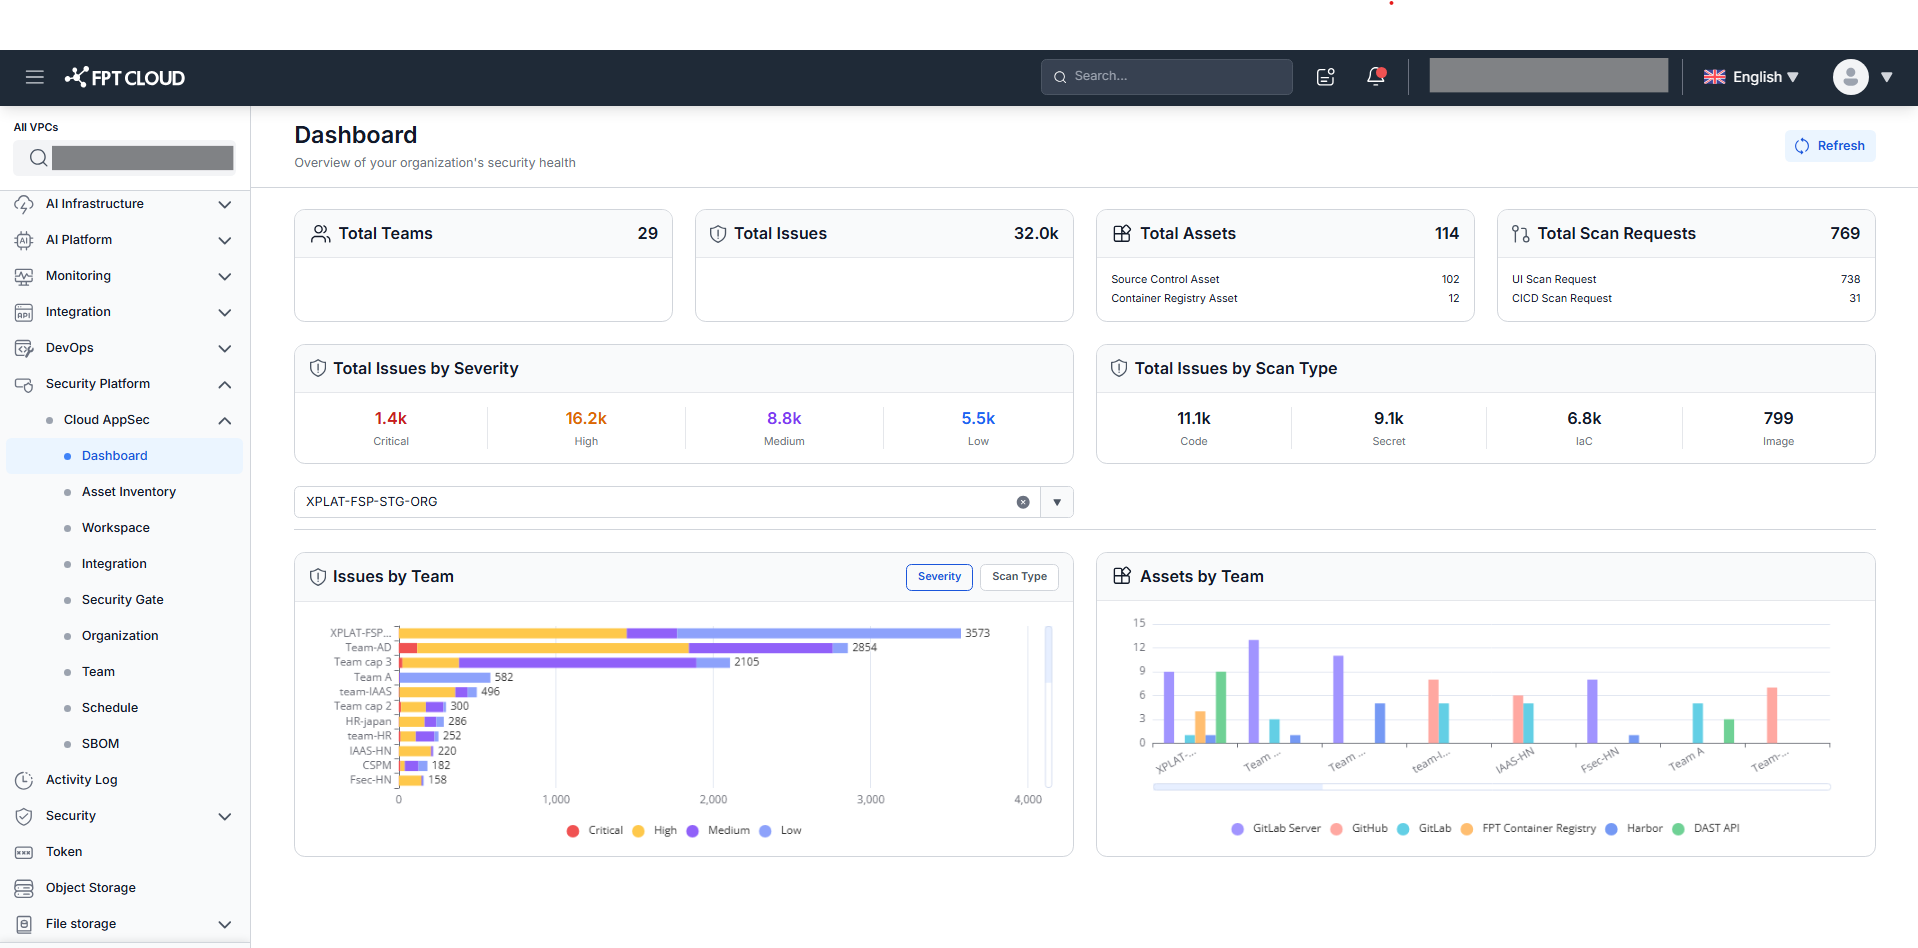
Organization overview metrics
| Metric | Description |
|---|---|
| Total teams | Total number of teams in the organization. |
| Total issues | Total issues from the most recent scan across all assets (all teams and sub-teams). |
| Total assets | Total assets — source control (GitHub, GitLab) and container registry (FCR, Harbor). |
| Total scan requests | Total scans run (Code Analysis + Secret Scanning + IaC + Image), split by UI and CI/CD requests. |
| Total issues by severity | Issue count by Critical, High, Medium, Low from the most recent scan. |
| Total issues by scan type | Issue count by Code Analysis, Secret Scanning, IaC Scanning, Image Scanning. |
Display format for counts: 0–9,999 shown in full; 10,000+ abbreviated in thousands (k), one decimal, rounded down.
Chart: Issues by team
Two stacked bar charts show issue counts per team:
- Issues by severity — layers: Critical / High / Medium / Low
- Issues by scan type — layers: Code Analysis / Secret Scanning / IaC Scanning / Image Scanning
The Y axis lists teams/sub-teams; the X axis shows total issue count. Click legend items to show or hide specific severity levels or scan types.
Chart: Assets by team
A grouped bar chart shows the number of assets (repositories, images) managed by each team.
- X axis — Team/sub-team names, sorted by total assets descending
- Y axis — Number of assets per integration tool
- Groups — Each team has up to 5 sub-columns, one per integration tool (GitHub, GitLab, GitLab Server, FCR, Harbor)
Click legend items to show or hide by integration tool. Use the Team filter at the top of the Dashboard to narrow data to a specific department.