Security graph
The Security Graph lets Tenant Admins visualize the full topology of cloud and Kubernetes resources across 7 layers, detect resources with open threats, investigate relationships between resources, and navigate seamlessly to Threat Detail for remediation.
Access Security Graph
From the sidebar, select Graph (under EXPLORE). The system loads the full resource topology graph.
You can also navigate directly from Threat Detail by clicking "View in Graph →" in any node popup within the Attack Path section.
Graph overview
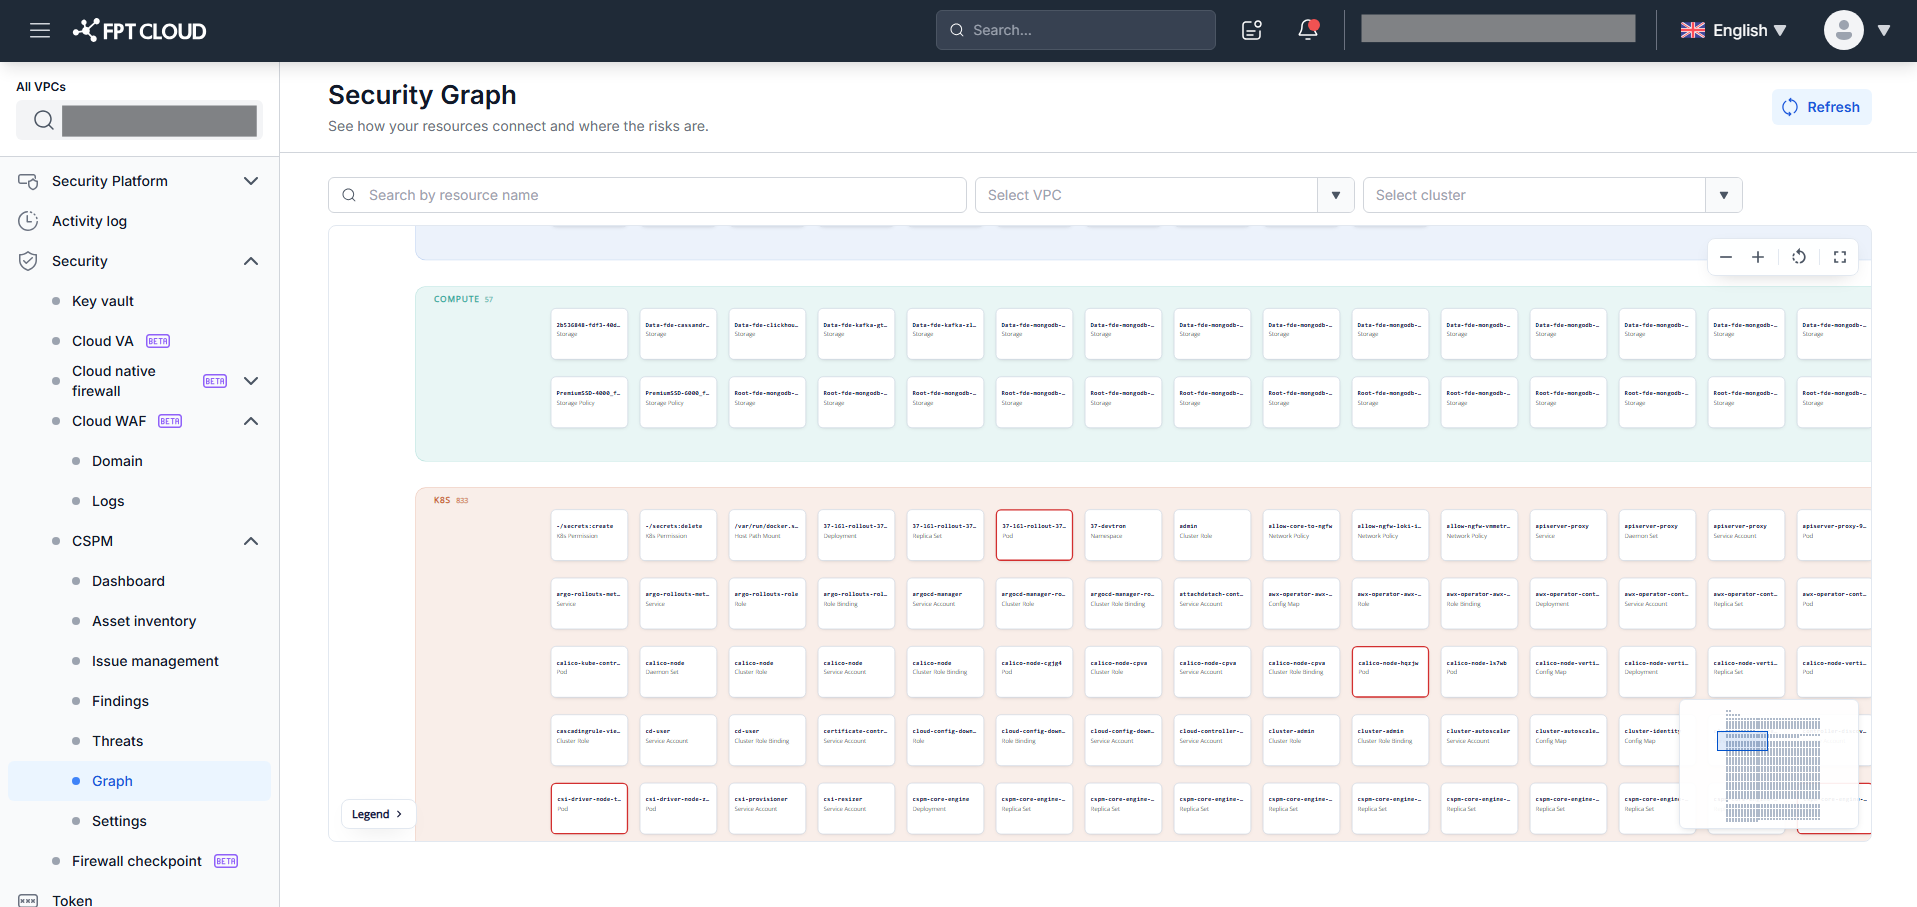
The graph canvas organizes resources in 7 layers from top to bottom:
| Layer | Resource types |
|---|---|
EXTERNAL | Resources external to your system |
ORGANIZATION | Organization/tenant-level resources |
NETWORK | VPC, subnet, network policies |
COMPUTE | VM, instances |
K8S | Kubernetes workloads (Pod, Deployment, Node, etc.) |
IDENTITY | IAM Role, Service Account, Kubernetes permissions |
DATA | S3 Bucket, database, storage |
Layers with no resources (after loading or applying a filter) are hidden from the canvas. Clearing the filter restores the layer if resources exist.
Node border colors:
- Red border — node has at least 1 linked Open threat → investigate immediately.
- Blue border — node is currently selected (Node Selected mode).
- Gray border — normal node with no Open threats.
Filter and search
| Filter | Description |
|---|---|
| Search by resource name | Type ≥ 3 characters to show autocomplete (up to 25 results). Select a result → canvas pans and zooms to that node. |
| Select VPC | Filter canvas to show only nodes in the selected VPC. |
| Select cluster | Filter canvas to show only nodes in the selected Kubernetes cluster. |
All filters combine with AND logic. If no nodes match, the canvas shows "No records found". Click × on any filter chip to remove it.
Refresh data: Click Refresh (top right) to reload the latest topology. A loading indicator appears while loading.
Graph controls
| Control | Description |
|---|---|
| Zoom out / Zoom in | Scale the canvas |
| Reset layout | Restore default position and scale |
| Full screen | Expand canvas to full screen |
| Mini Map (bottom right) | Scaled-down preview of the full graph; click or drag to pan the viewport |
| Legend > (bottom left) | Toggle the symbol reference panel (5 items) |
Legend panel:
| Symbol | Meaning |
|---|---|
| □ (gray border) | Normal resource — no Open threats |
| □ (red border) | Open threat — has at least 1 linked Open threat |
| → (solid line) | Outgoing connection — connection leaving this node |
| ⇢ (dashed line) | Incoming connection — connection entering this node |
| REL | Relationship type — see CONNECTIONS panel for details |
Zoom blur: When zoomed out below a threshold, node cards appear blurred to optimize display. Zoom in to restore clarity.
View Node Detail
Click any node in the graph canvas → the Node Detail panel opens on the right.
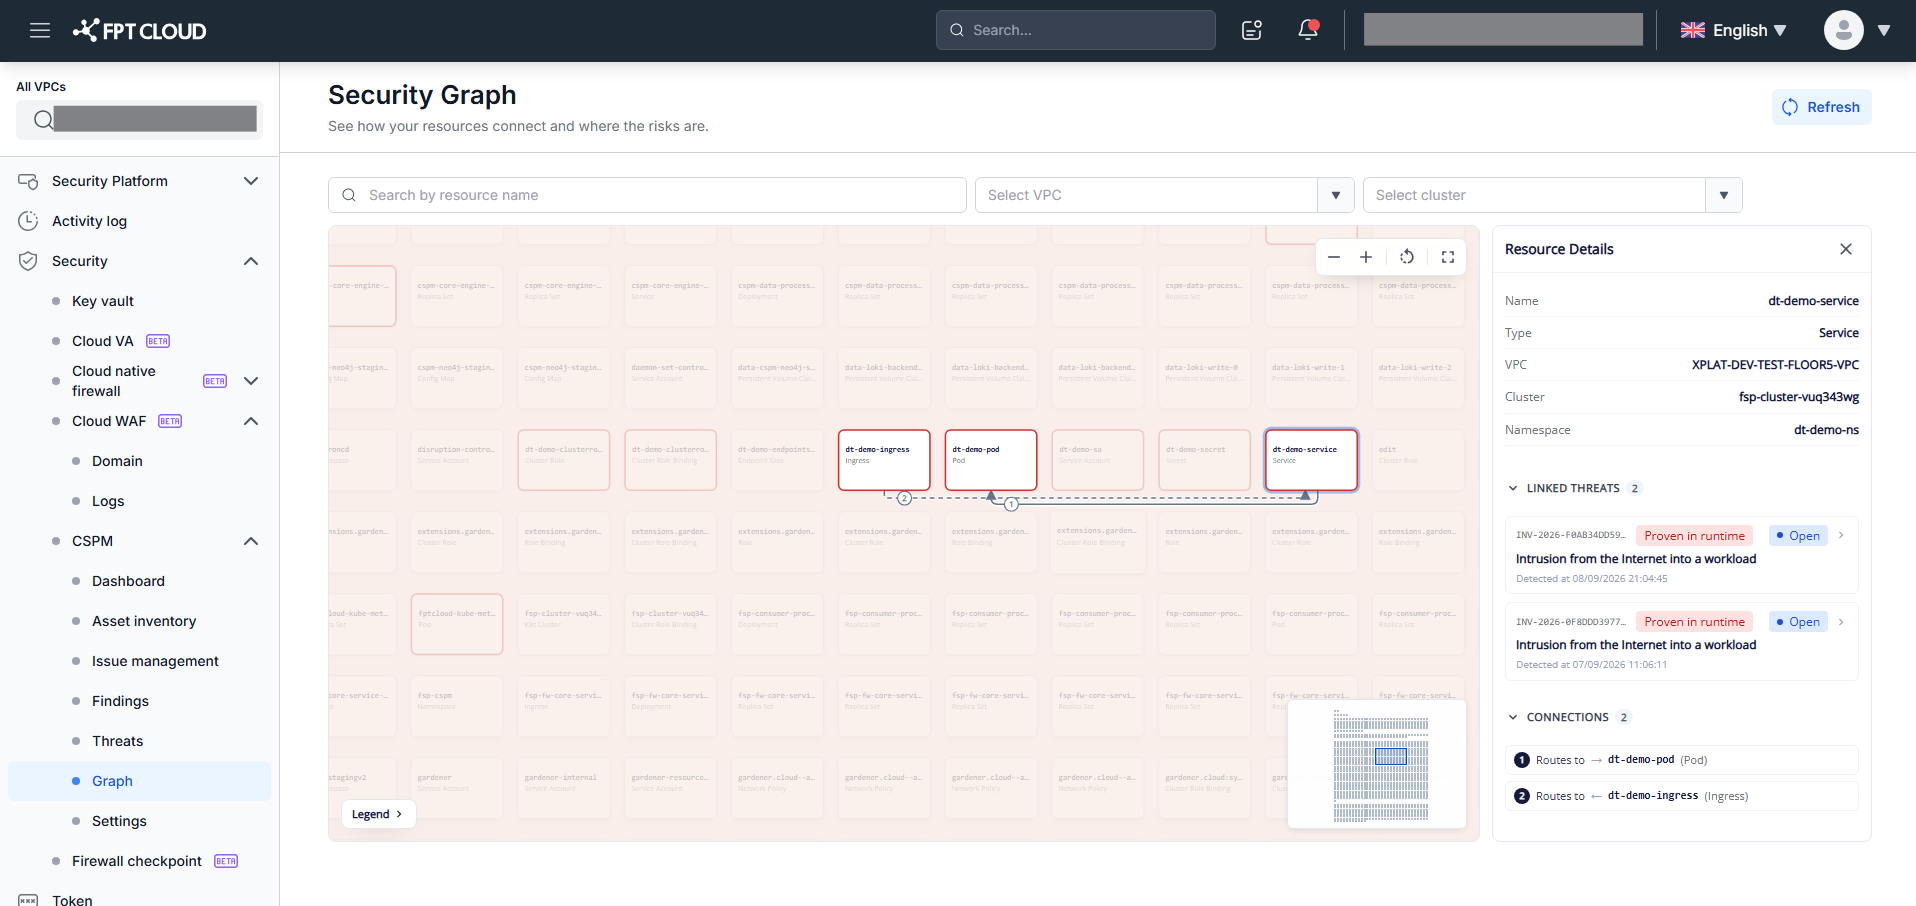
Node Detail fields:
| Field | Description |
|---|---|
| Name | Full resource name (no truncation) |
| Type | Resource type (e.g., VM, Pod, IAM Role) |
| VPC | VPC name. Shows "—" if not in any VPC |
| Cluster | Kubernetes cluster name. Shows "—" if not in any cluster |
| Namespace | Namespace. Shows "—" for cluster-scoped or cloud resources |
Canvas in Node Selected mode:
- Selected node: blue border (takes priority over red Open threat border).
- Directly connected nodes and edges: highlighted; edges show sequence numbers (1, 2, 3...).
- Non-connected nodes and edges: reduced opacity (still visible but dimmed).
Toggle panel: Click the same selected node again → Node Detail panel closes; canvas returns to full display.
LINKED THREATS
The LINKED THREATS [N] section in the Node Detail panel lists Open threats linked to this node. N = number of Open threats.
- Only threats with
status = Openare shown; Closed threats do not appear. - Sorted by Detected At, newest first.
- Each item shows: Threat ID · Type badge · Threat title · Detected at.
- Click any item → navigates to that threat's Threat Detail page.
- When N = 0: section shows "No records found".
CONNECTIONS
The CONNECTIONS [N] section lists the node's direct connections (edges). N = number of connections.
Format of each item: [number] · [relationship] · [→ or ←] · [node name] · ([node type])
- Outgoing (→): connection from this node to another node (solid arrow on canvas).
- Incoming (←): connection from another node to this node (dashed arrow on canvas).
- The sequence number matches the number shown on the corresponding edge in the canvas.
Navigate from Threat Detail
In Threat Detail, while viewing the Attack Path:
- Click any node in the graph → a popup shows the node name, resource type, and "View in Graph →" button.
- Click "View in Graph →" → Security Graph opens, navigates to that node with:
- Node highlighted with a blue border.
- Node Detail panel automatically opened with that node's data (LINKED THREATS + CONNECTIONS).
What's next
- Threats — manage threat alerts and track investigation progress.