Threats
The Threats module gives Tenant Admins a centralized view of all security threats in your tenant — correlated from runtime signals, CSPM, and KSPM detectors and enriched by Security Graph. You can view, filter, change status, and investigate each threat in detail.
Threat List
Access the Threat List
- From the sidebar, select Threats. The Active Threats tab is selected by default.
- The system displays a threat table sorted by Detected At descending (newest first).
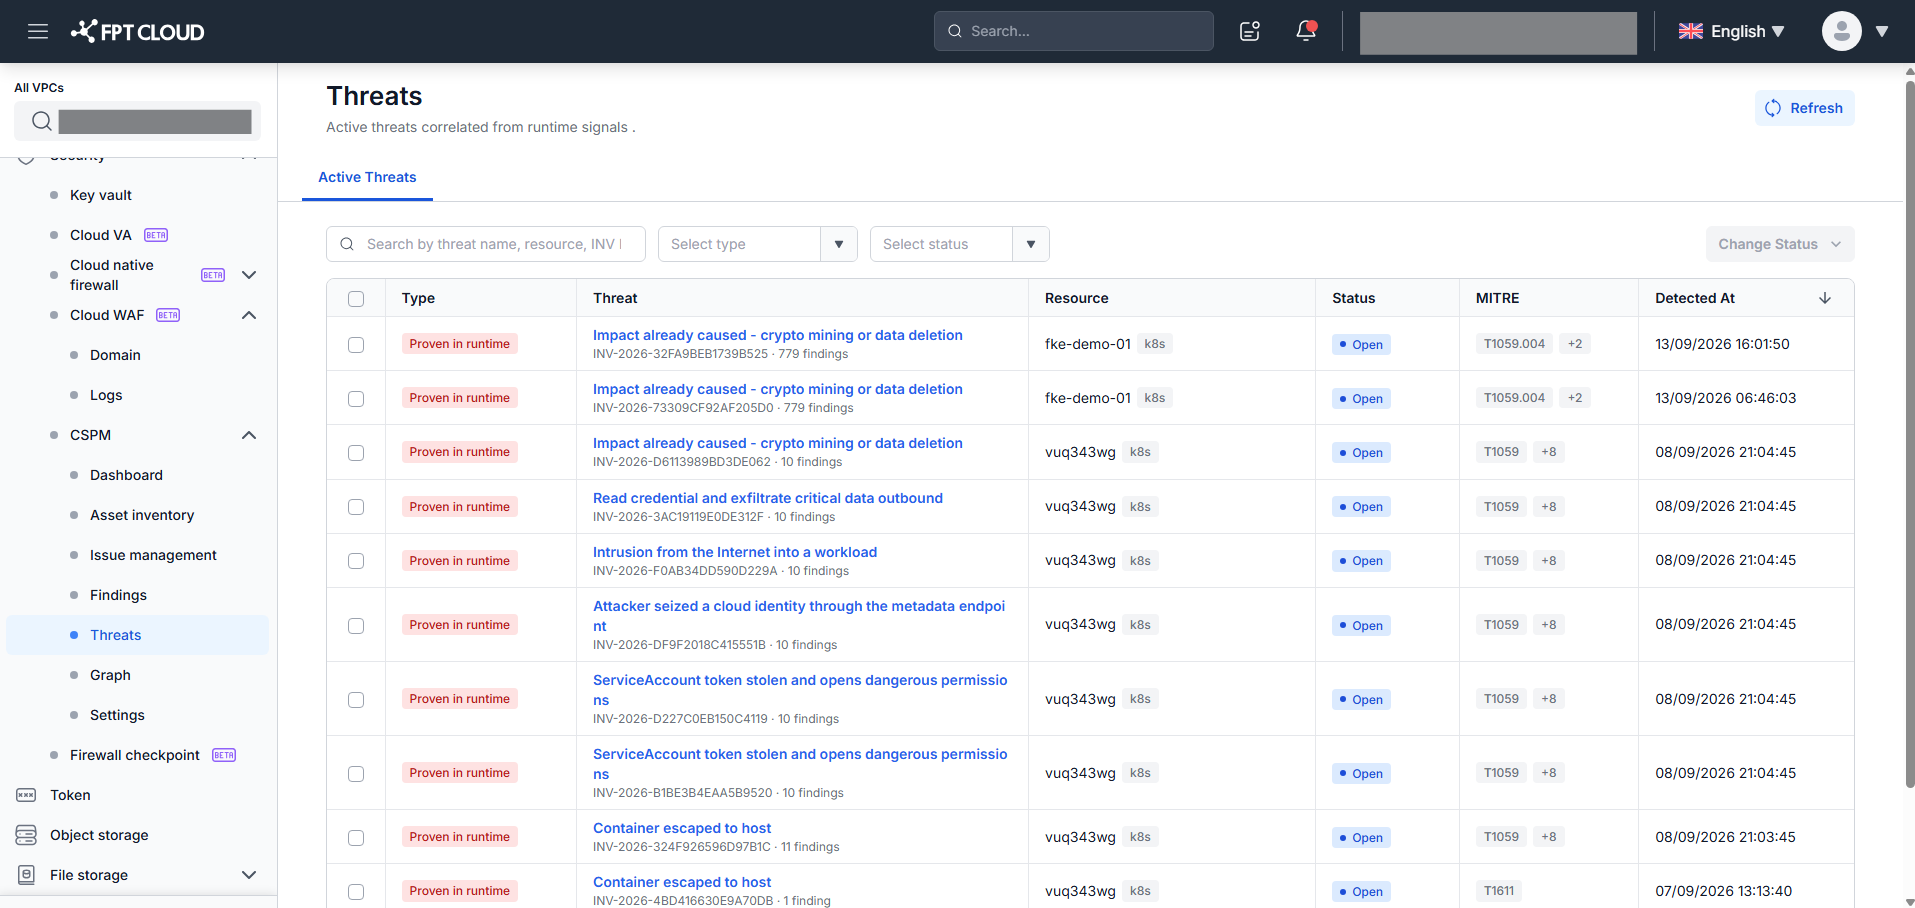
Threats are continuously correlated and enriched. Click Refresh (top right) to load the latest data. Current filters and sort order are preserved.
Understand the threat table columns
| Column | Description |
|---|---|
| Type | Validation level: Proven in runtime (red badge — confirmed via runtime signal) or Theoretical (blue badge — based on theoretical attack path analysis) |
| Threat | Line 1: Threat title (link — click to open Threat Detail). Line 2: INV ID and finding count ("INV-YYYY-XXXX · N finding(s)") |
| Resource | Primary affected resource and resource type. If multiple resources: first resource + "+N" |
| Status | Open (blue badge — unresolved) or Closed (gray badge — closed) |
| MITRE | MITRE ATT&CK technique ID. If multiple techniques: first technique + "+N" |
| Detected At | Detection timestamp (dd/MM/yyyy HH:mm:ss). Click to toggle sort ascending/descending |
Search and filter
| Filter | Description |
|---|---|
| Search | Search by threat name or INV ID. Type ≥ 3 characters to activate (spaces count). Case-insensitive. |
| Type | Filter by Proven in runtime or Theoretical (single select). Click × to clear. |
| Status | Filter by Open or Closed (single select). Click × to clear. |
All filters combine with AND logic. Applying any filter or changing page size resets the table to page 1.
Sort: Click the Detected At column header to toggle ascending/descending order (default: descending).
Select multiple threats
Tick the checkbox on each row to select threats. The Select all checkbox in the table header selects all rows on the current page only.
Switching pages or changing page size clears the current selection and disables the Change Status button.
Change threat status (Close / Re-open)
Use this feature to close or re-open one or more threats at once.
- Select one or more threats using the checkboxes. The Change Status button becomes enabled.
- Click Change Status. A dropdown appears with available actions:
| Selection | Actions shown |
|---|---|
| Only Open threats selected | Close |
| Only Closed threats selected | Re-open |
| Mixed (Open and Closed) | Close and Re-open |
- Click the desired action. A Close threat or Re-open threat modal appears.
- Enter an optional comment (max 2,000 characters) explaining the reason.
- Click Save (N) — N = number of threats that will be changed. The system updates status and shows a confirmation toast.
Mixed selection behavior:
Close→ only Open threats are closed; already-Closed threats are unchanged.Re-open→ only Closed threats are re-opened; already-Open threats are unchanged.- The toast shows the number of threats actually changed (N).
Partial failure: If some threats cannot be updated (network/server error), the toast still reports the number that succeeded. A failure message appears only if all threats in the batch fail.
Pagination
| Control | Description |
|---|---|
| Rows per page | 10 (default) / 25 / 50 / 100 |
| X–Y of Z | Shows current page range and total matching threats |
| Previous / Next | Page navigation; Previous is disabled on page 1, Next on the last page |
Threat Detail
Open Threat Detail
In the Threat List, click the threat name (the primary-colored link on line 1 of the Threat column) to open Threat Detail.
Clicking other areas of the row (Type badge, Resource, Status, MITRE, Detected At) does not navigate to Threat Detail.
Click ← Back to return to the Threat List. Current filters, sort order, and page are restored.
Header and Info Card
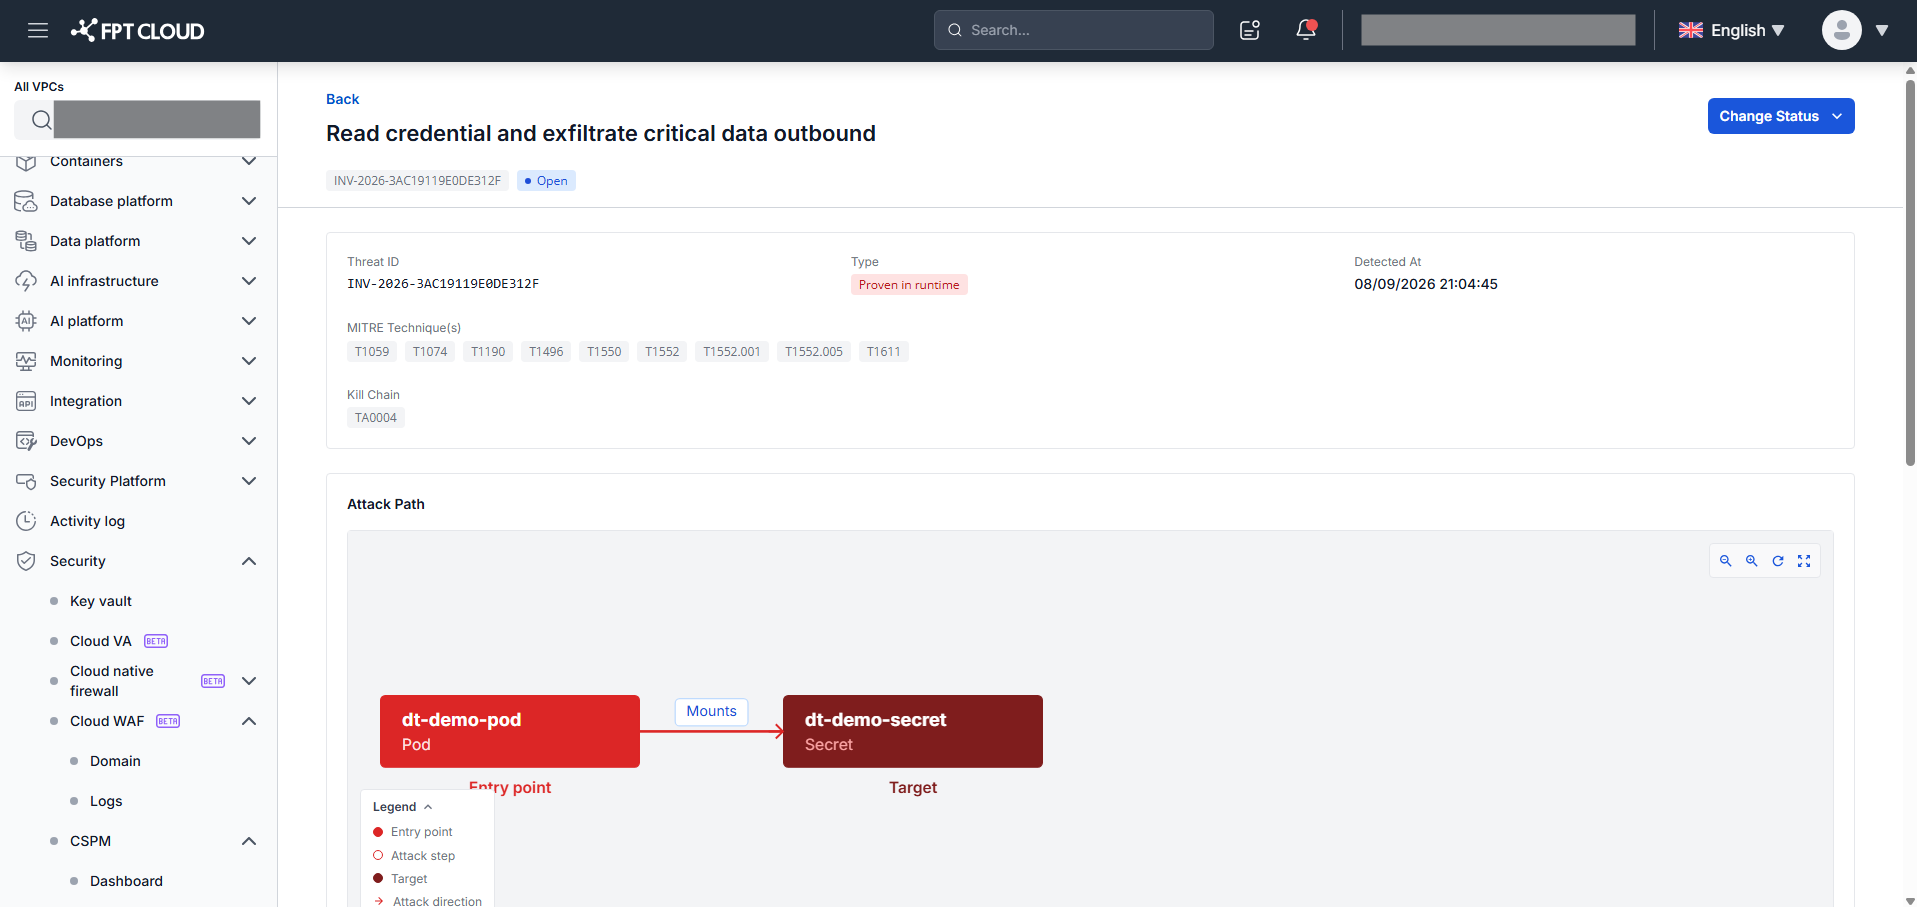
Header displays:
- Threat title (H1)
- INV ID badge — unique identifier (e.g.,
INV-2026-0420) - Status badge —
Open(blue) orClosed(gray) - Change Status button — see Change status from Threat Detail
Info Card fields:
| Field | Description |
|---|---|
| Threat ID | INV ID of the threat |
| Type | Proven in runtime (red) or Theoretical (blue) |
| Detected At | Detection timestamp (dd/MM/yyyy HH:mm:ss) |
| MITRE techniques | Technique badges — hover to see full name; click to open MITRE ATT&CK in a new tab |
| Kill chain | Attack kill chain phase (e.g., Collection, Impact). Shows "—" if not available |
Attack Path
The Attack path section displays a visual graph of the attack flow from Entry point to Target.
Node types in the graph:
| Component | Meaning |
|---|---|
| Node with Entry point badge | Source node — starting point of the attack (solid red border) |
| Node with Target badge | Target node — the attack objective (solid dark red border) |
| Intermediate node (Attack step) | Intermediate nodes in the attack chain (red border, no role badge) |
| Arrow + edge label | Attack direction and action (e.g., "Runs", "Grants role") |
Graph controls:
| Control | Description |
|---|---|
| Zoom out / Zoom in | Scale the graph |
| Reset layout | Restore default position and scale |
| Full screen | Expand graph to full screen |
| Legend (bottom left) | Toggle symbol reference: Entry point · Attack step · Target · Attack direction |
Click a node in the Attack Path:
Click any node → a popup shows the node name, resource type, and a "View in Graph →" button.
Click "View in Graph →" → navigates to Security Graph with that node highlighted and the Node Detail panel automatically opened.
Click outside the popup (canvas area or any area outside the popup) → popup closes.
Factors contributing to this threat
The Factors contributing to this threat table lists the issues and findings that contribute to this threat, with 5 columns:
| Column | Description |
|---|---|
| Id | Finding/issue ID |
| Source | Detection source: CSPM Issue (orange) · KSPM Issue (blue) · K8s Runtime (purple) |
| Finding/issue | Finding or issue name |
| Asset | Affected asset name and resource type badge |
| Detected at | Detection timestamp (dd/MM/yyyy HH:mm:ss) |
Pagination: default 10 rows/page; options: 10/25/50/100.
Tab Comments
The Comments tab is selected by default when opening Threat Detail.
- Comments are displayed in ascending chronological order (oldest first). No pagination.
- Each comment shows: avatar (initials), author name, timestamp, and content.
- Empty state: "No records found".
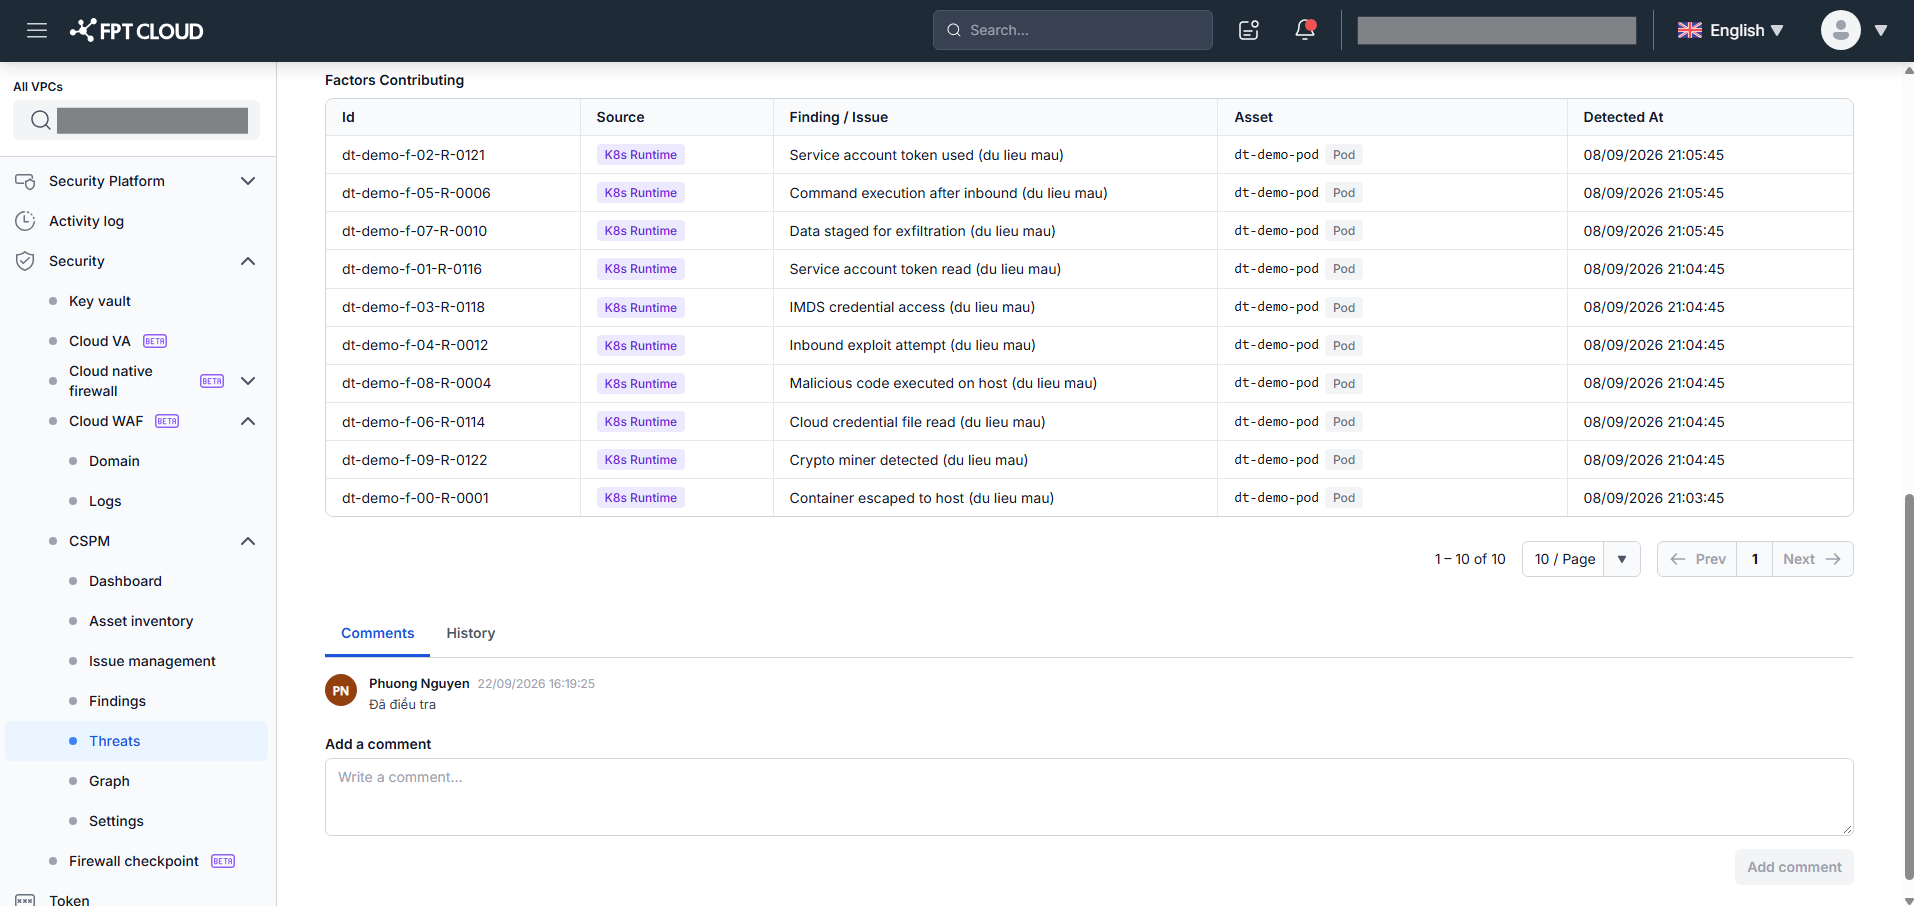
Add a comment:
- Enter content in the "Add a comment..." textarea (max 2,000 characters).
- The Add comment button becomes enabled when content is present.
- Click Add comment → the new comment appears at the bottom of the list; textarea is cleared.
Tab History
Click the History tab to view the Activity Log — a timeline of all events for this threat in ascending chronological order.
Each entry shows: datetime · event description · actor.
The first entry is always "Threat detected · System". Every status change and added comment creates a new History entry with timestamp and actor.
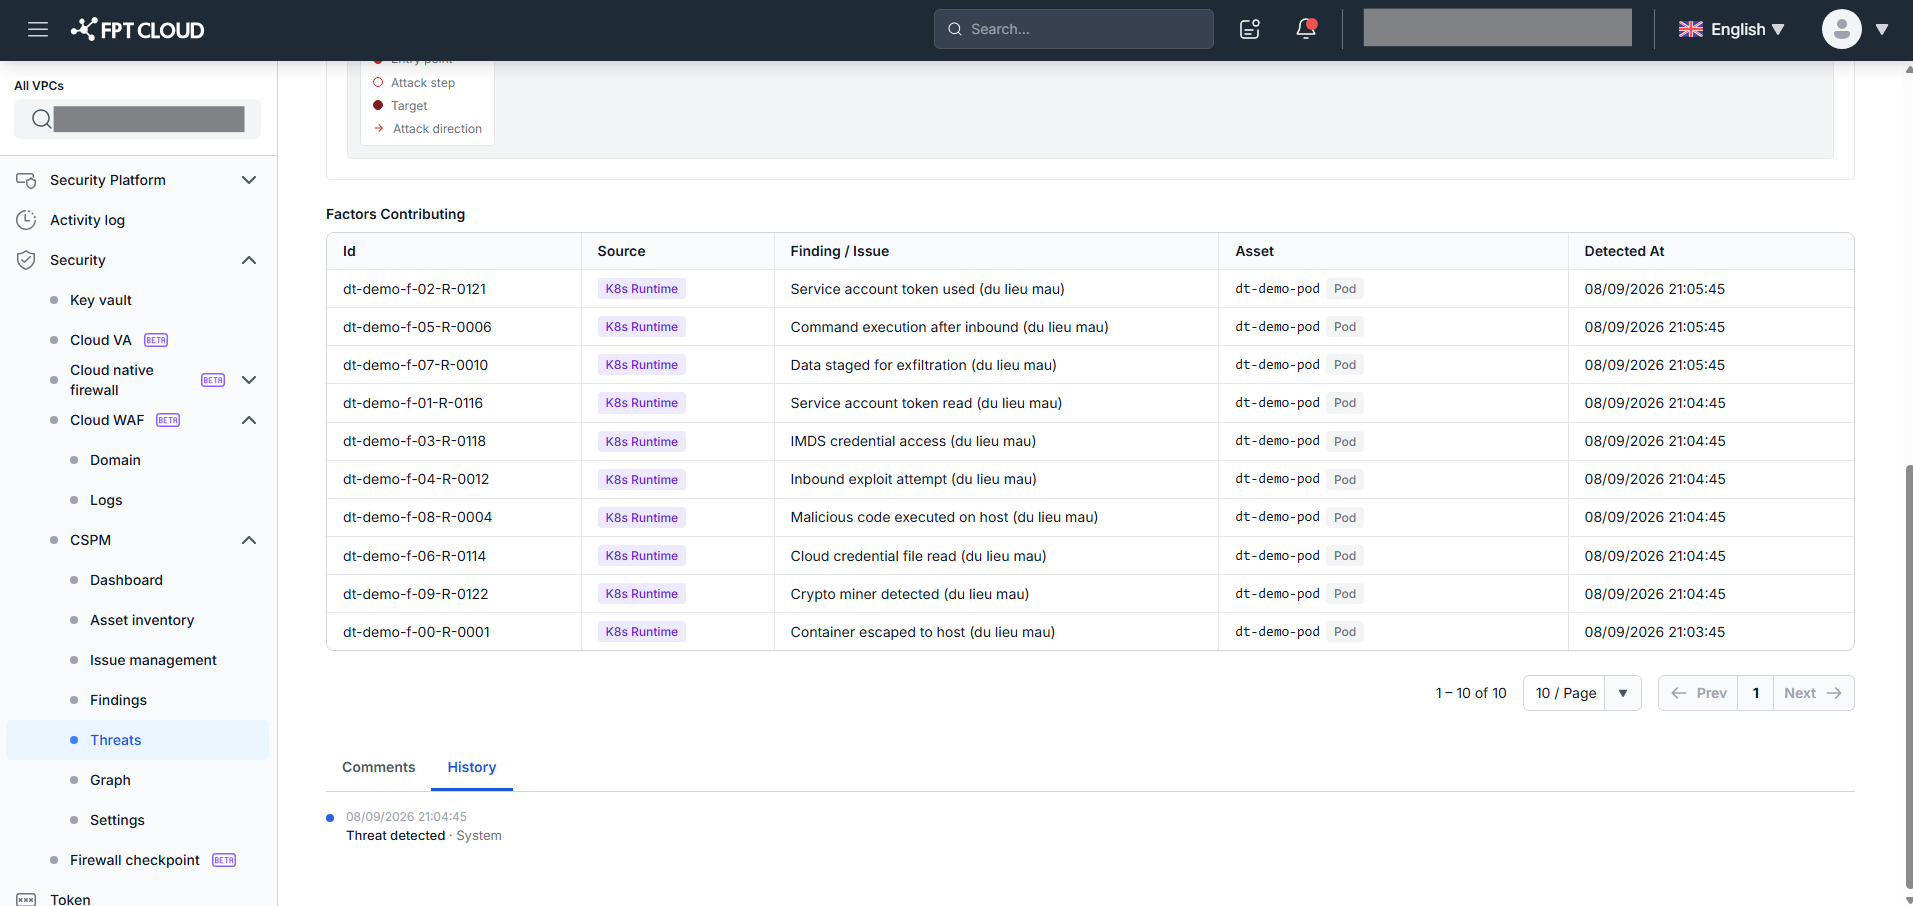
Change threat status from Threat Detail
Click Change Status in the header → a dropdown appears:
- Status = Open: shows
"Close" - Status = Closed: shows
"Re-open"
The process is the same as Change threat status in the Threat List, but applies to this single threat only. The button shows Save (1) (N is always 1).
What's next
- Security Graph — investigate affected resources in the graph topology.