WAF logs
The Logs screen shows the traffic log for all domains in your tenant. FSP Admins use it to monitor blocked requests, investigate attack patterns by type and source IP, verify policy effectiveness, and refresh for real-time log updates.
View WAF logs
- From the sidebar, select Cloud WAF → Logs. The log table appears with Last 24h as the default time range, sorted newest first.
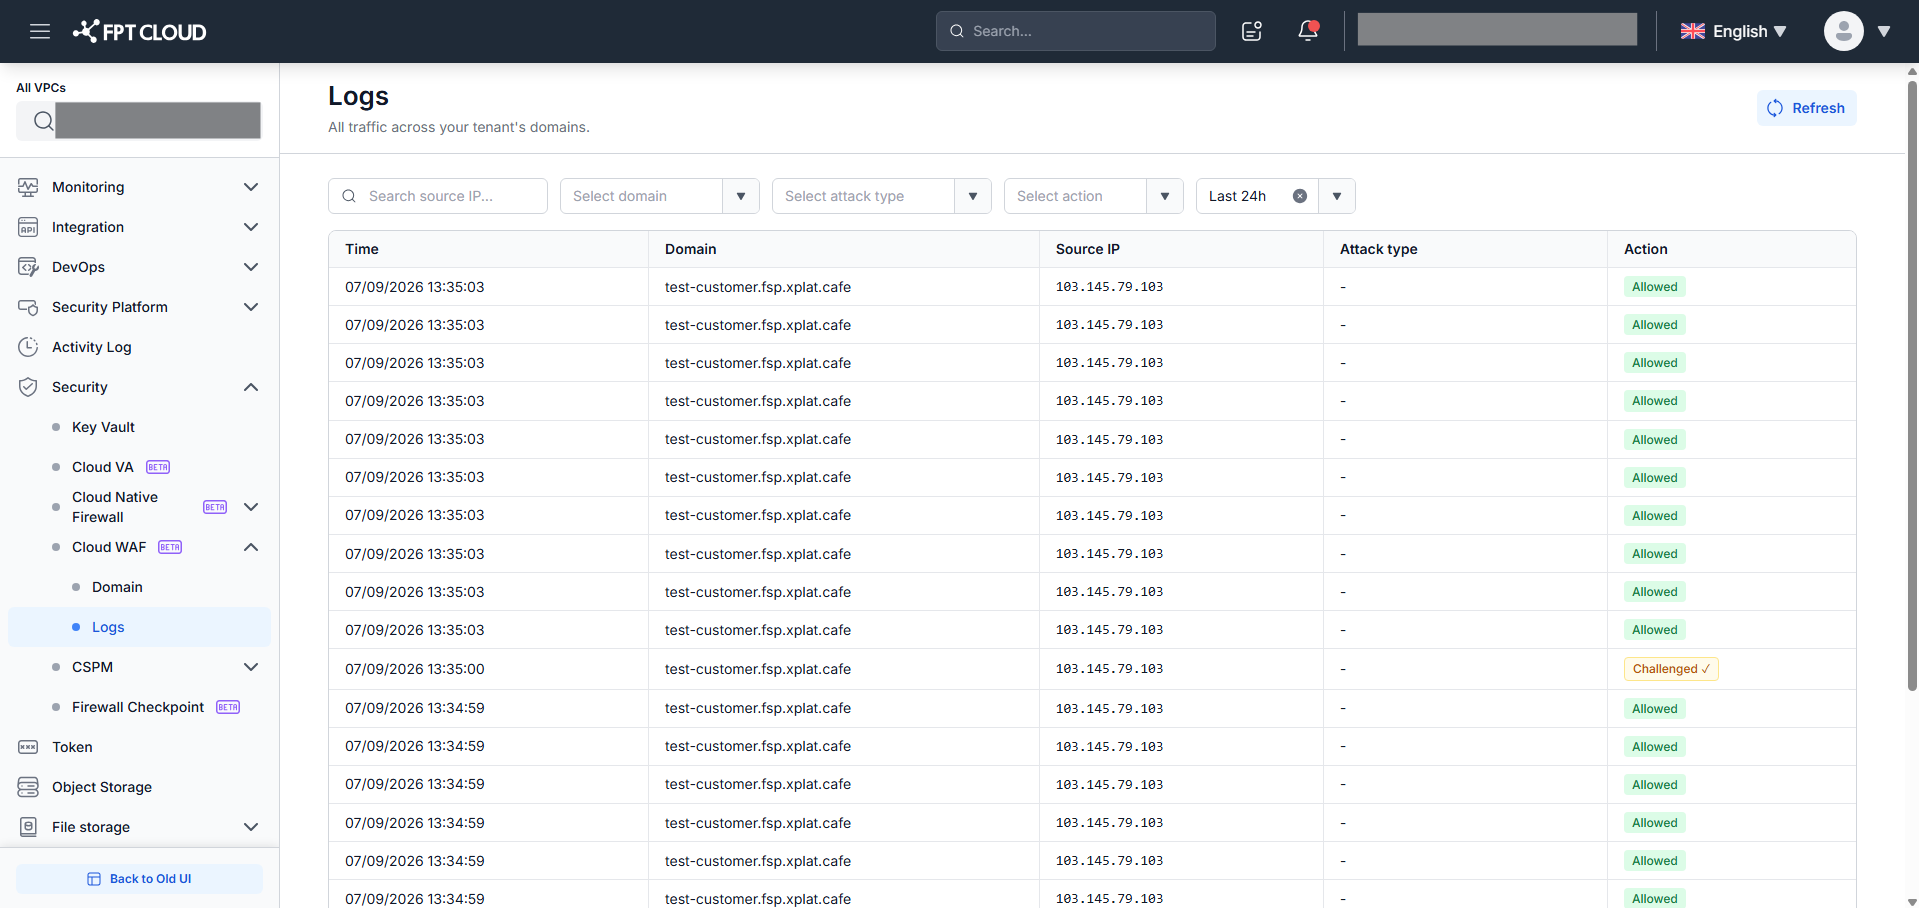
Log table columns:
| Column | Description |
|---|---|
| Time | Request timestamp (DD/MM/YYYY HH:mm:ss) |
| Domain | Target domain of the request (across all tenant domains) |
| Source IP | Source IP address of the request |
| Attack Type | WAF-detected attack type (mapped from OWASP CRS rule ID); shows "—" for legitimate traffic (Allowed, no attack) |
| Action | WAF action applied: Blocked (red) · Allowed (green) · Challenged ✓ (light) · Challenged ✗ (amber) |
Action badge meanings:
- Blocked — request rejected with 403
- Allowed — legitimate request forwarded to origin
- Challenged ✓ — visitor was challenged and passed Browser Verification
- Challenged ✗ — visitor was challenged but did not pass
Filter and search logs
Use the filter bar to narrow results:
| Filter | Description |
|---|---|
| Source IP (search box) | Type all or part of an IP address — real-time filtering, case-insensitive. Click × to clear. |
| Select domain | Select a specific domain from the dynamic list of tenant domains. Click × to remove. |
| Select attack type | Select from 20 attack types: SQL Injection · XSS · RFI · LFI · RCE · Node.js Injection · SSRF · PHP Injection · Java Injection · Scanner · DoS · IP Reputation · Method Violation · Protocol Violation · Session Fixation · Anomaly Score · Data Leakage · Web Shell · Rate limit exceeded · Other. Click × to remove. |
| Select action | Select: Blocked / Allowed / Challenged ✓ / Challenged ✗. Click × to remove. |
| Time range | Last 1h / Last 6h / Last 24h (default) / Last 7d / Last 30d. Always has a value — no × button. |
All filters combine with AND logic. Changing any filter immediately updates the list and resets pagination to page 1. No matches → "No records found" (column headers remain).
Refresh logs
Click "Refresh" (top right) → the system fetches new logs since the last load, preserving all active filters:
- New logs found → inserted at the top of the list; the "Showing X–Y of N" counter updates.
- No new logs → toast "No new logs".
- If on page > 1 → pagination resets to page 1 after refresh.
Navigate pages
- Counter "Showing X–Y of N" — shows the current page range and total matching logs.
- Page size dropdown:
10 / page/25 / page(default) /50 / page/100 / page. - "Previous page" disabled on the first page; "Next page" disabled on the last page.
Attack investigation tip: To investigate a specific attack wave, filter by Attack Type (e.g., SQL Injection) + Time range Last 1h + a specific Domain. Then use the Source IP search to see the full request history from that IP.
Log data is stored 100% in Vietnam (data residency compliant).
What's next
- Security policies — update IP Rules or Rate Limit rules based on what you see in logs.
- Domain details — check origin health or update TLS certificate if a domain shows Unprotected.