Runtime Findings
Runtime Findings shows all security signals detected by the Kubernetes runtime agent, classified by severity and MITRE ATT&CK technique. You can search, filter, and inspect full details of each finding.
Observe mode: This version supports observe mode only. Findings are displayed for monitoring; no response actions are available from this screen.
Prerequisites
- The runtime agent must be installed on at least one cluster. See K8s Asset Inventory.
View the findings list
-
In the sidebar, select Findings.
The Finding List loads with the Last 24h time range applied by default.
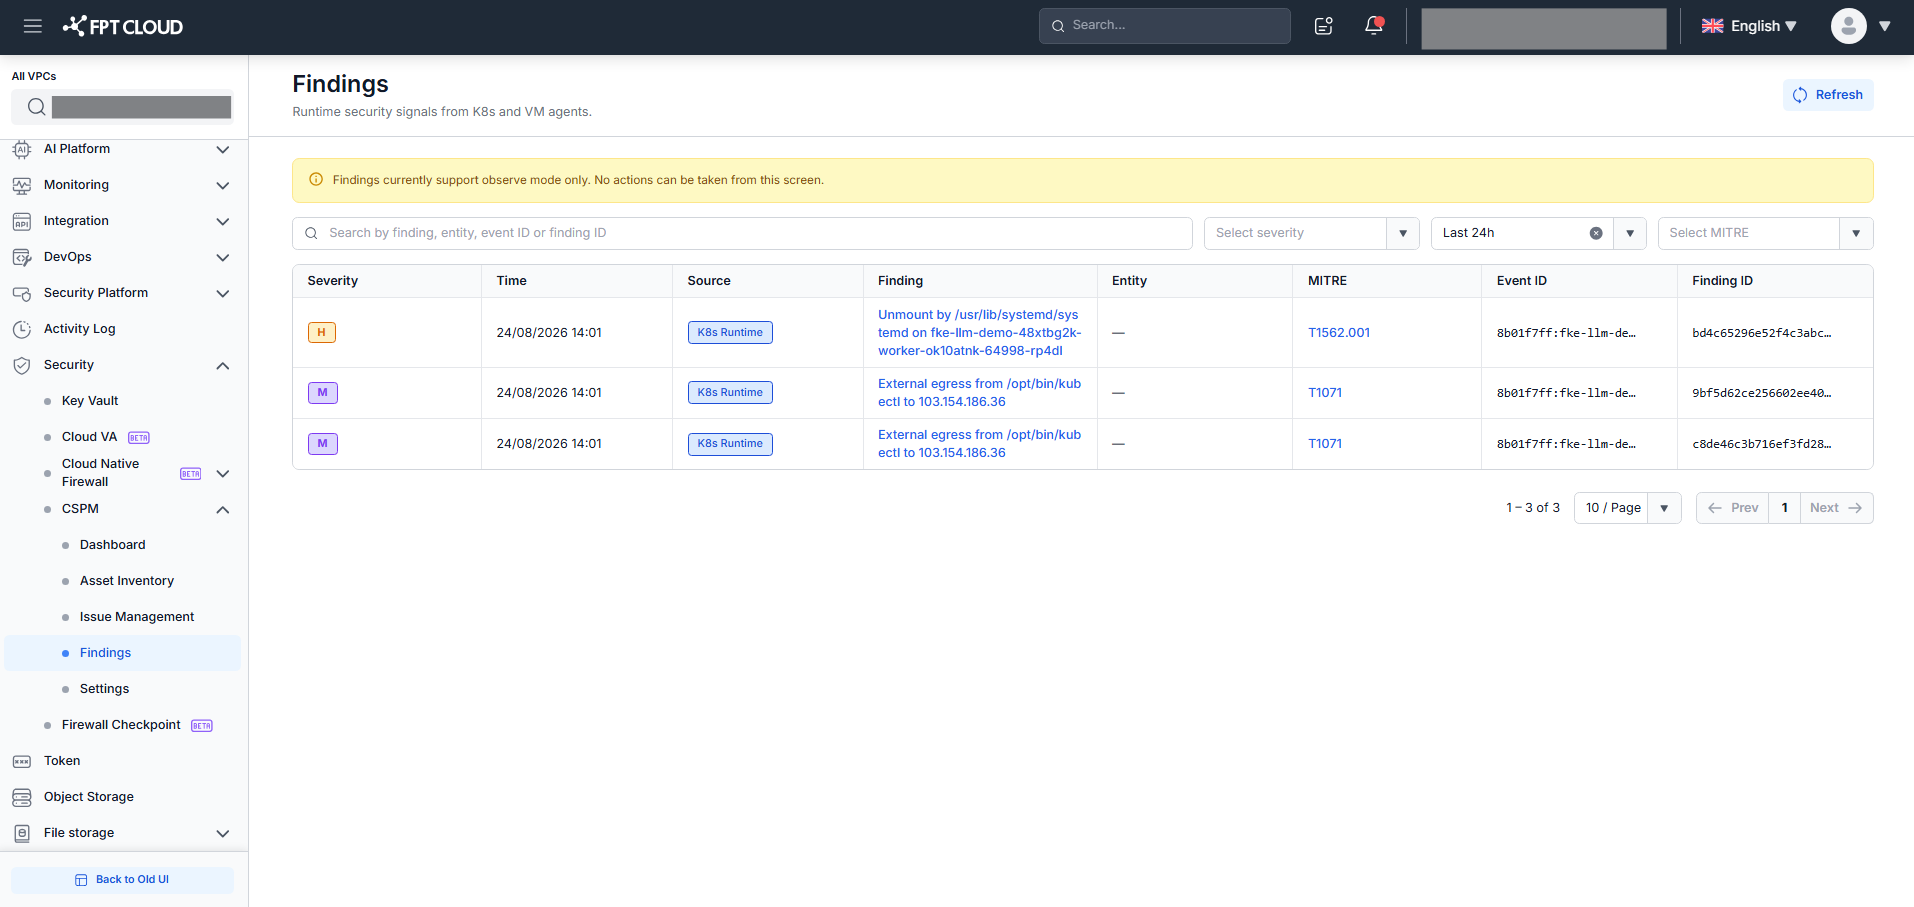
- Review the columns.
| Column | Description |
|---|---|
| Severity | Severity badge: C 9.1 (Critical) · H 7.8 (High) · M 5.4 (Medium) · L 3.2 (Low) — abbreviated letter + decimal score |
| Time | Detection timestamp (DD/MM/YYYY HH:mm), newest first |
| Source | Detection source badge: K8s Runtime · K8s Audit · VM Runtime |
| Finding | Finding name as a link — click to open the Finding Detail drawer |
| Entity | Affected resource: line 1 = resource name + type tag; line 2 = namespace (for namespaced resources) |
| MITRE | MITRE ATT&CK technique ID as a link — click to open the MITRE reference in a new tab; hover to see the full technique name |
| Event ID | Event identifier (monospace) |
| Finding ID | Unique finding identifier — 32-character hex string (monospace) |
Search and filter
| Filter | Description |
|---|---|
| Search | Search by finding name, entity, Event ID, or Finding ID. Real-time filter. |
| Severity | Filter by: Critical / High / Medium / Low |
| Time | Filter by time range: Last 1h / Last 24h (default) / Last 3d / Last 7d |
| MITRE | Filter by MITRE technique ID with prefix match — selecting T1059 matches T1059.001, T1059.004, etc. |
All filters combine with AND logic. Click Refresh to reload findings while keeping your current filters.
Use Severity = Critical combined with Time = Last 1h to focus on the most critical threats in the last hour.
View finding detail
-
Click the finding name (bold link) in the Finding column.
The Finding Detail drawer slides in from the right. The Finding List remains visible behind it.
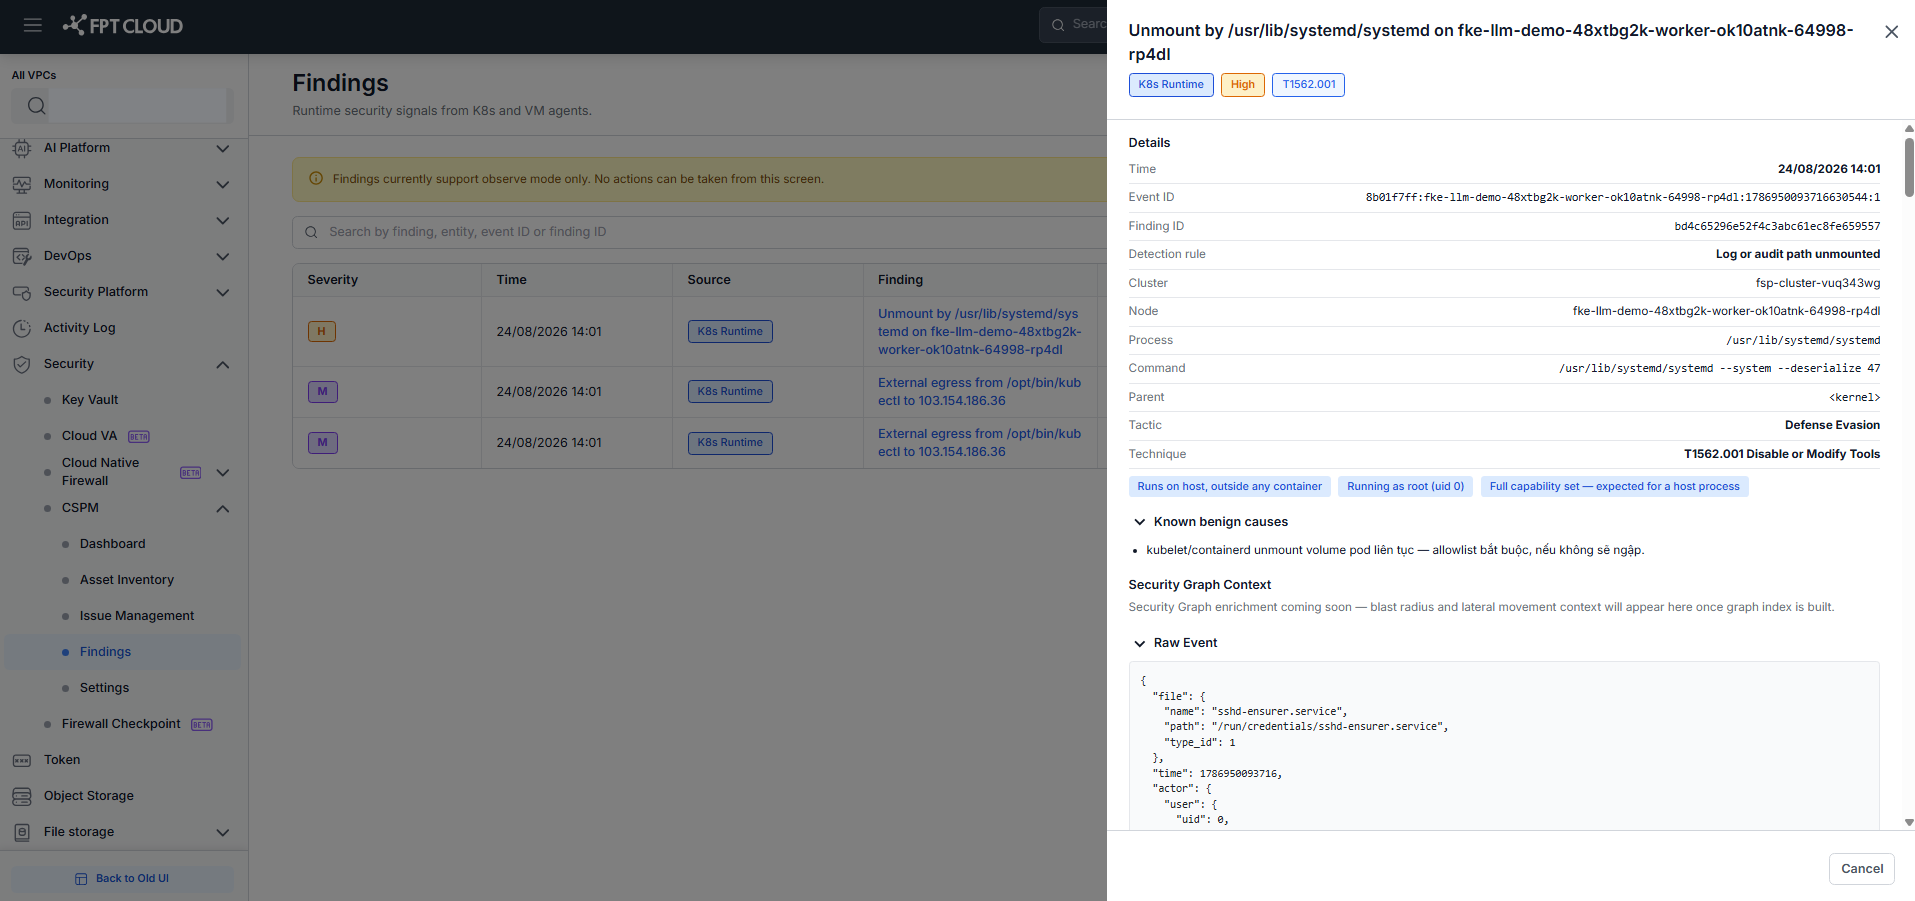
The header shows the finding title, and three badges: Source · Severity · MITRE (link to MITRE ATT&CK).
- Review the Details section.
| Field | Description |
|---|---|
| Time | Detection timestamp |
| Event ID | Event identifier (monospace) |
| Finding ID | Unique finding ID (monospace) |
| Detection rule | Rule name that triggered the finding — different from the finding title |
| Cluster | Cluster where the finding occurred |
| Node | Node name |
| Namespace | Namespace. Displays "—" for cluster-scoped resources. |
| Pod | Pod name. Displays "—" for node-level findings. |
| Container | Container name. Displays "—" if not available. |
| Image | Container image in registry/image:tag format. Displays "—" if not available. |
| Process | Binary path that triggered the finding (monospace). Hidden for K8s Audit findings. |
| Command | Full command line with arguments (monospace). Hidden for K8s Audit findings. |
| Parent | Parent process (monospace). Hidden for K8s Audit findings. |
| Tactic | MITRE ATT&CK tactic (e.g., Privilege Escalation) |
| Technique | MITRE technique ID + name (e.g., T1611 Escape to Host) |
| Context flags | Risk flags shown only when true: Running as root · Full capability set · Dangerous capabilities: CAP_SYS_ADMIN · Shares host PID namespace · Touched sensitive path · Egress to public internet |
-
Expand Known Benign Causes (optional).
This section lists common false-positive scenarios for the detection rule. Click Expand to view, Collapse to hide. The section is hidden entirely if no benign causes are defined for the rule.
-
Review Security Graph Context.
Placeholder: "Security Graph enrichment coming soon — blast radius and lateral movement context will appear here once graph index is built."
-
Expand Raw Event (optional).
Click Expand JSON to view the raw event data in JSON format. Click Collapse JSON to hide.
-
Click × or click outside the drawer to close it and return to the Finding List with your filters preserved.
Frequently asked questions
Why are there no findings after installing the agent? The agent needs time to start collecting and sending data after a successful installation. If no findings appear after 30 minutes, verify the network egress rules from the Network Requirement Banner and contact FPT Support.
Can I block or kill a process from the Findings screen? Version v1.2.2 supports observe mode only — no response actions are available from the Findings screen. Response actions will be added in a future version.
What does X/Y in the Agents active badge mean?
Some nodes in the cluster do not have an active agent (agent down). Hover the warning icon on the badge to see the affected node count. Contact FPT Support if the agent does not recover.
What's next
- Manage K8s Assets — install or uninstall the runtime agent on clusters.