Dashboard
The Dashboard gives you an at-a-glance view of your cloud security posture. Use it to quickly assess risk level, open findings, and resource exposure.
View the Dashboard
Step 1. Go to Security → Security Hub → Dashboard.
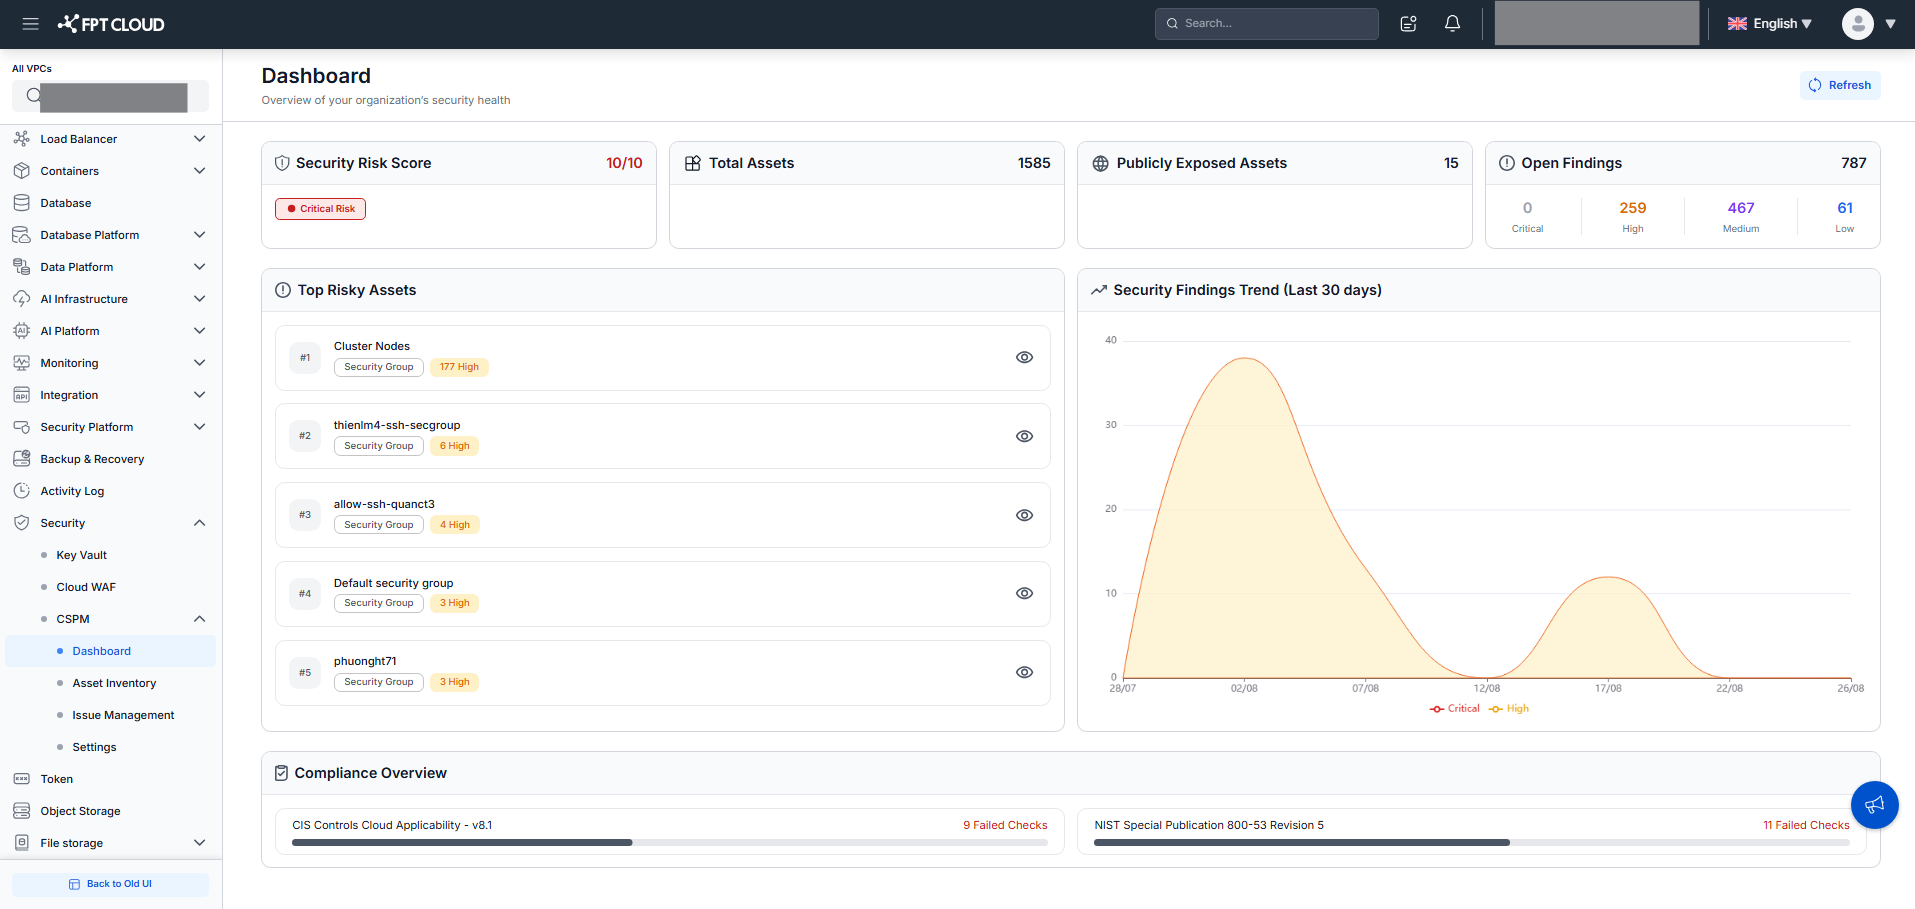
The Dashboard screen appears with security metrics for your current tenant.
Step 2. Check overall risk.
Review the Security Risk Score:
- Low score (e.g., 1.5 / 10) — your environment has low risk.
- High score (e.g., 9 / 10) — your environment has high risk requiring attention.
Step 3. Assess resource exposure.
- Total Assets — total number of resources being monitored.
- Publicly Exposed Assets — resources accessible from the internet.
Step 4. Prioritize security findings.
Under Open Findings, check counts by severity and address them in this order: Critical → High → Medium → Low.
Step 5. Identify high-risk resources.
In Top Risky Assets, view the resources with the most findings. Click the icon next to an asset to see its associated findings.
Step 6. Track trends over time.
Review the Security Findings Trend chart to see whether your finding count is increasing or decreasing.