Pipeline History & Logs
1. Before You Start
Before using these features, make sure that:
- You are logged in to FPT Cloud.
- You have access to the Project and the corresponding Pipeline.
- The Pipeline has been run at least once (for Run History) or has at least one Deployment (for Deployment History).
2. Run History
Run History is a tab on the Pipeline detail screen that lets you view the complete history of all Pipeline runs, including status, actor, timing, and available actions.
2.1 Access Run History
There are two ways to open the Run History screen:
Option 1 — From the Project Detail screen:
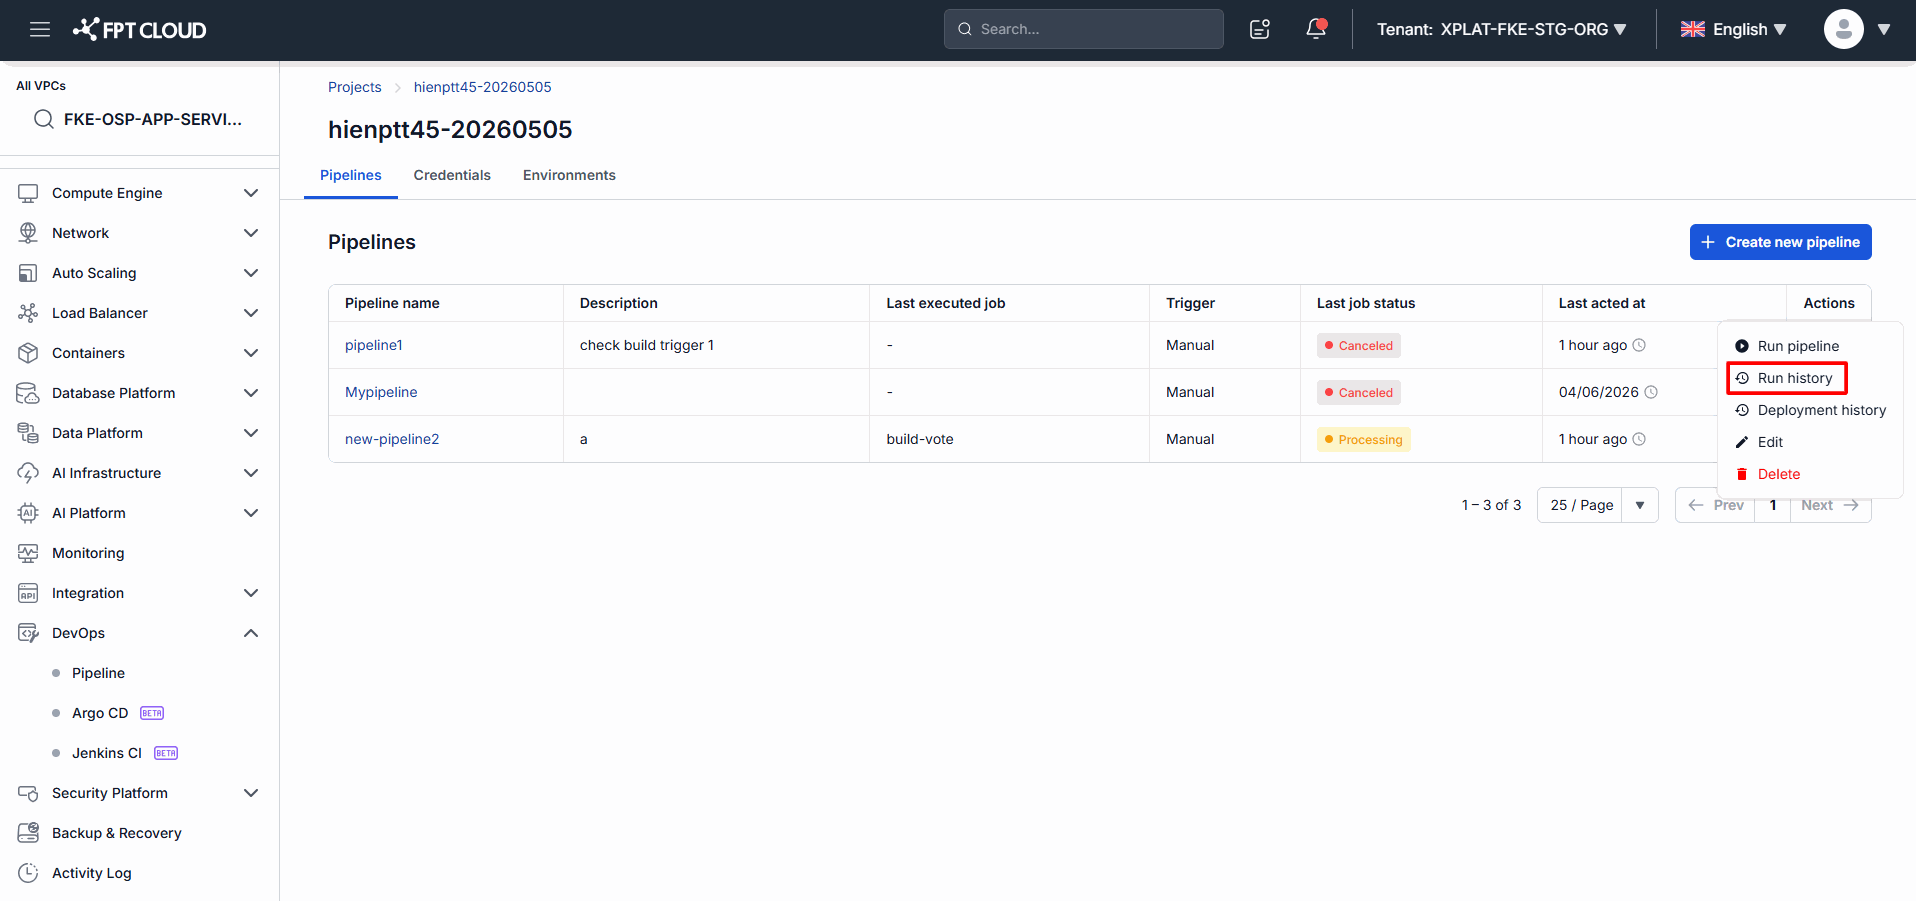
- On the Project Detail screen, find the Pipeline you want to inspect.
- Click the (⋮) icon in the Pipeline's row.
- Select Run history from the dropdown.
⚠️ The "Run history" option is disabled if the Pipeline has never been run.
Option 2 — From the Pipeline Detail screen:
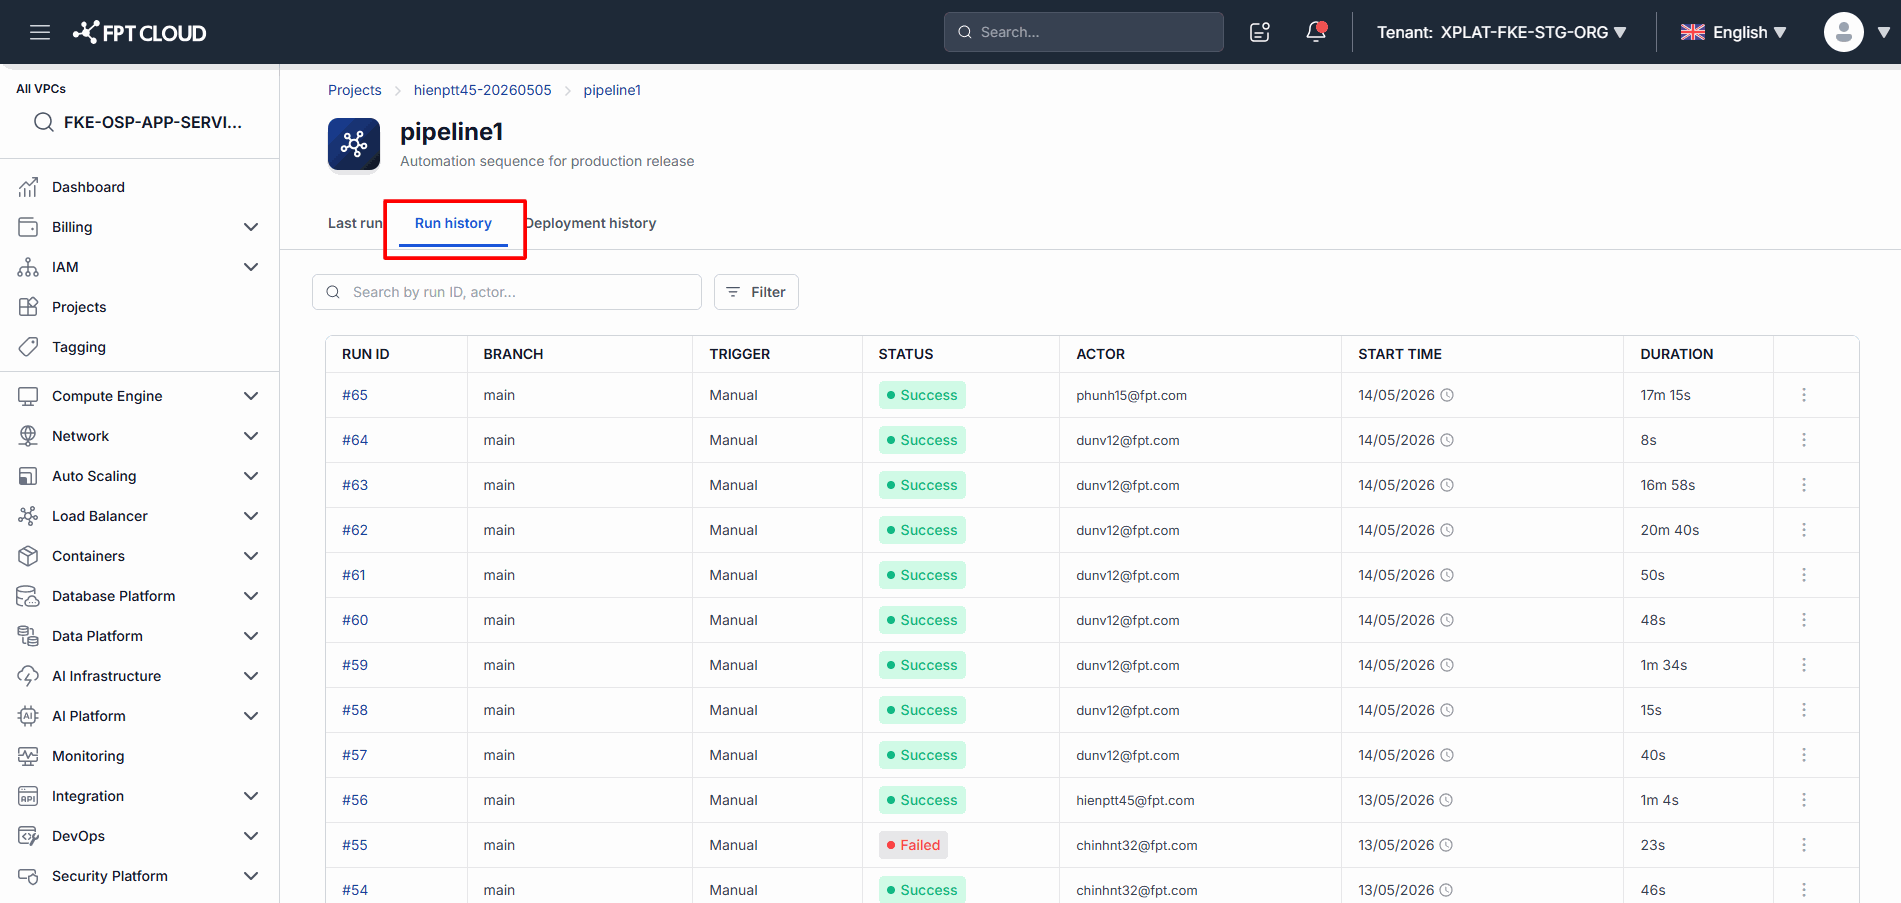
- Open the Pipeline detail screen.
- Click the Run history tab in the navigation bar.
2.2 Run History Interface
| Element | Description |
|---|---|
| Pipeline name | The name of the Pipeline currently being viewed |
| Tab: Run history | Currently active tab — shows the list of runs |
| Tab: Last run | Switch to view the most recent run |
| Search bar | Search by Run ID, commit, or branch |
| Filter | Advanced filtering by multiple criteria |
| Runs table | List of runs with full details |
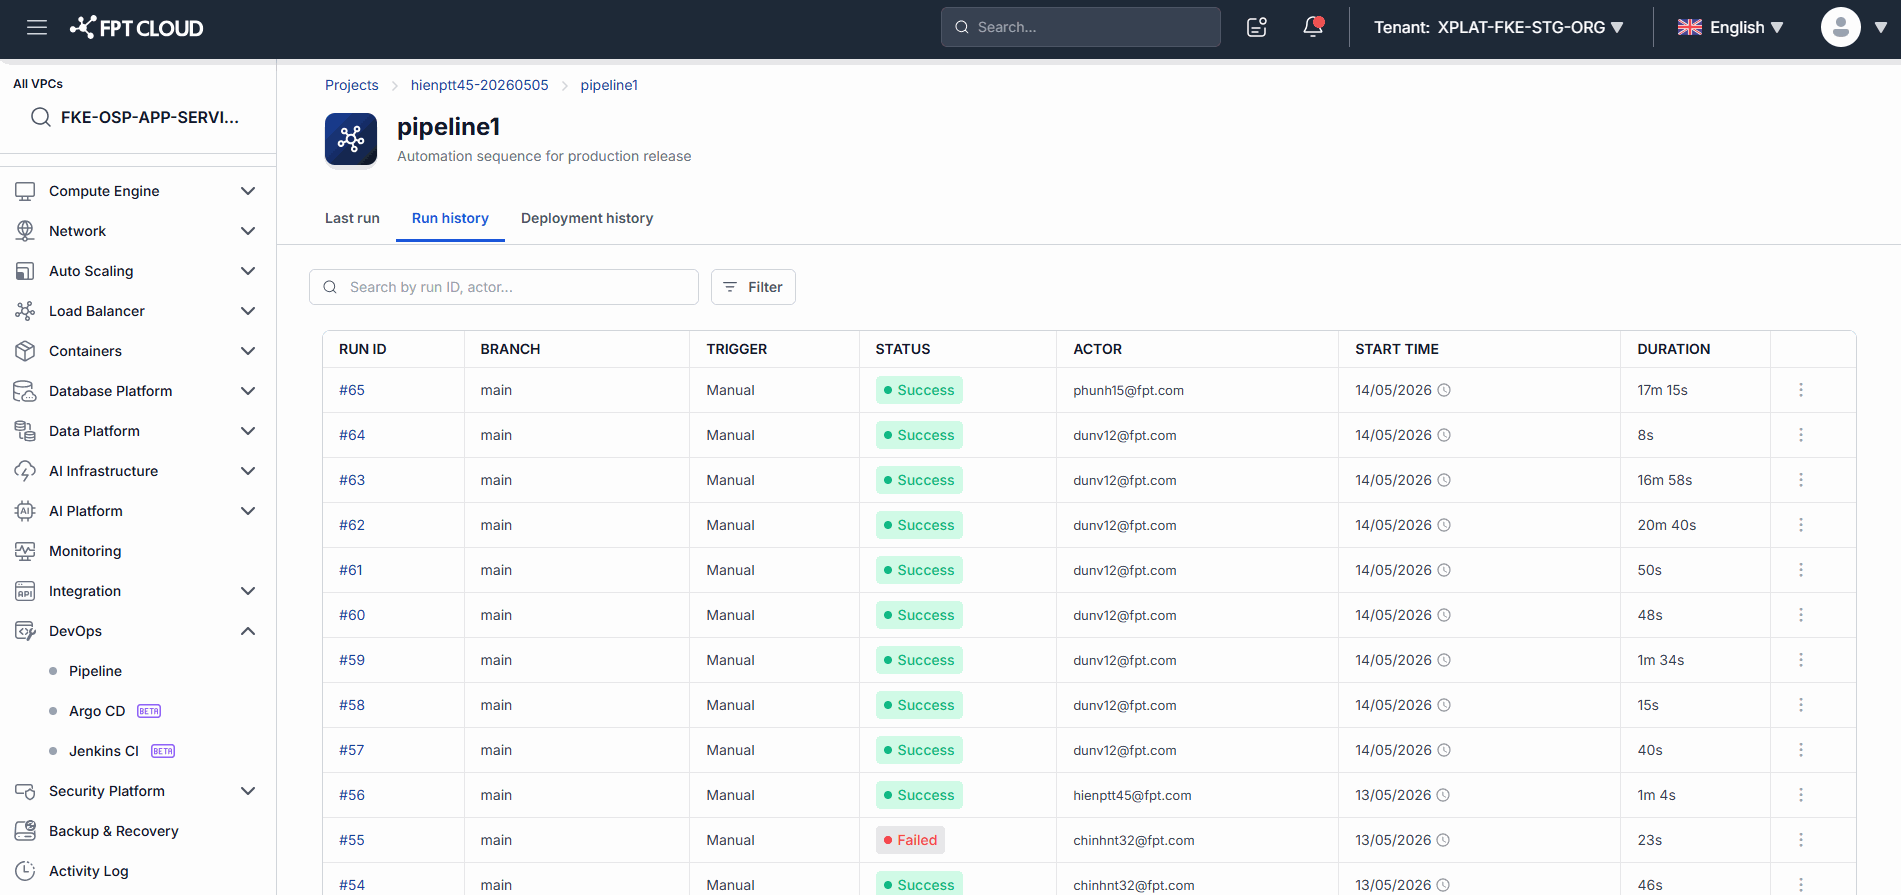
2.3 Reading the Runs Table
Each row represents one Pipeline run:
| Column | Meaning |
|---|---|
| Run ID | The run identifier (e.g. #1050). Click to open the run detail. |
| Branch | The source code branch used |
| Commit ID | The commit that triggered the run. Click to open the commit on Git. |
| Status | Success / Fail / Processing / Cancel |
| Duration | Execution time (mm:ss) |
| Start time | When the run started |
| Actor | The user or system that triggered the Pipeline |
| ⋮ (Action menu) | View detail |
2.4 Search Runs
- Click the Search bar above the table.
- Enter a keyword:
- Run ID — e.g.
1050 - Branch — e.g.
main,feature/login - Commit ID — partial SHA is accepted
- Run ID — e.g.
- Press Enter or wait for the auto-search (~300 ms).
The table updates immediately with matching runs. If no results are found, the table shows "No results found."
💡 Search is case-insensitive. Enter at least 2 characters to activate the search.
2.5 Advanced Filter
- Click the Filter button in the top-right corner of the table.
- Configure the filter options:
| Filter | Usage |
|---|---|
| Status | Select one or more: Success, Fail, Processing, Cancel, Timeout |
| Trigger type | Select: Push, Merge, Manual, Tag |
| Time range | Select a date range (From – To) |
| Duration | Enter a duration range (min – max) |
| Actor | Select the user who triggered the run |
- Click Apply to apply the filter, or Reset to clear all filters.
2.6 View Run Detail
Option 1: Click the Run ID directly (e.g. #1050).
Option 2: Click the (⋮) icon in the run's row and select View detail.
The system navigates to the Run Detail screen with full information about that run.
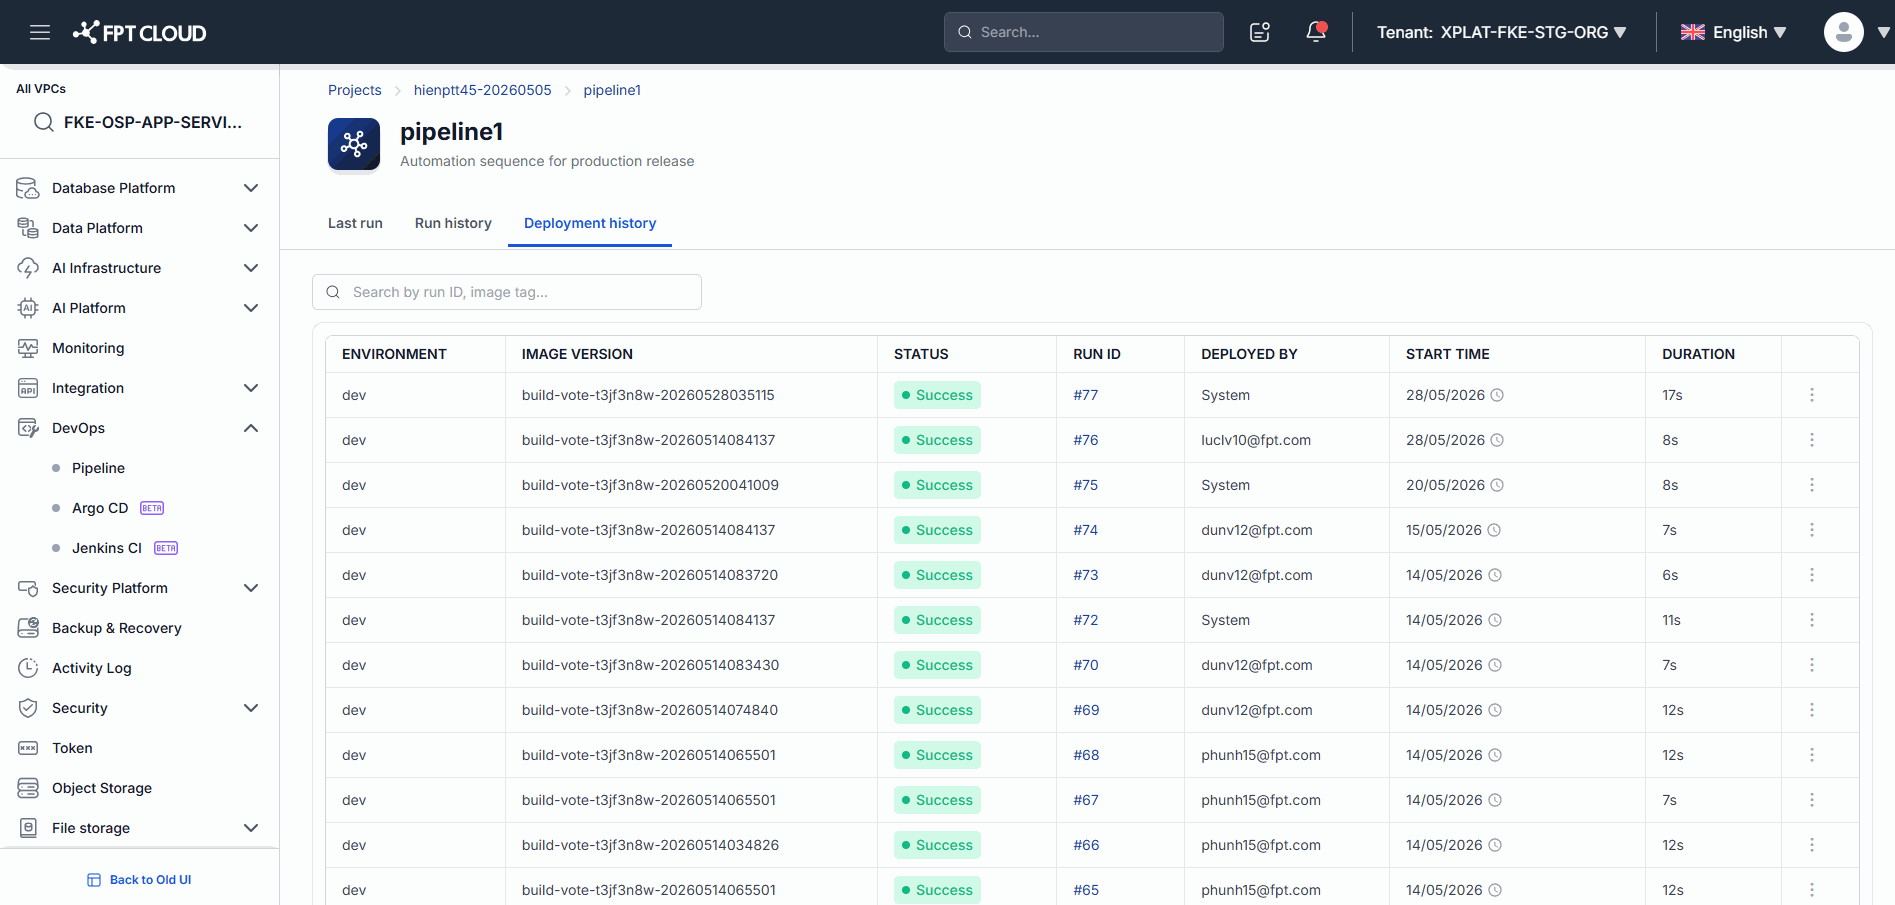
3. Deployment History
Deployment History is a tab on the Pipeline detail screen that lets you track all deployments of the Pipeline per environment, including artifact version, deployment status, the associated Pipeline Run, and available actions.
3.1 Access Deployment History
- From the Pipeline detail screen, click the Deployment history tab.
The system loads the deployment list. A loading indicator is shown while data is being fetched.
⚠️ The tab is only visible to users with Pipeline view permission. If no data is available, the system shows "No deployments found."
3.2 Deployment History Interface
| Column | Meaning |
|---|---|
| Deployment ID | The deploy identifier (e.g. #D2103) |
| Artifact Version | The application version deployed (e.g. v1.5.2). Hover to see image details. |
| Status | Success / Failed / Processing / Canceled |
| Run ID | The Pipeline Run that created this Deployment. Click to open Run Detail. |
| Deployed by | The user or system that performed the deployment |
| Start Time | When the deployment started (e.g. Oct 24, 2023 14:20) |
| Duration | Total execution time (Xm Ys) |
| ⋮ (Actions) | View log, View run, Cancel |
3.3 View Image Details
Hover over the Artifact Version column to see the full image information.
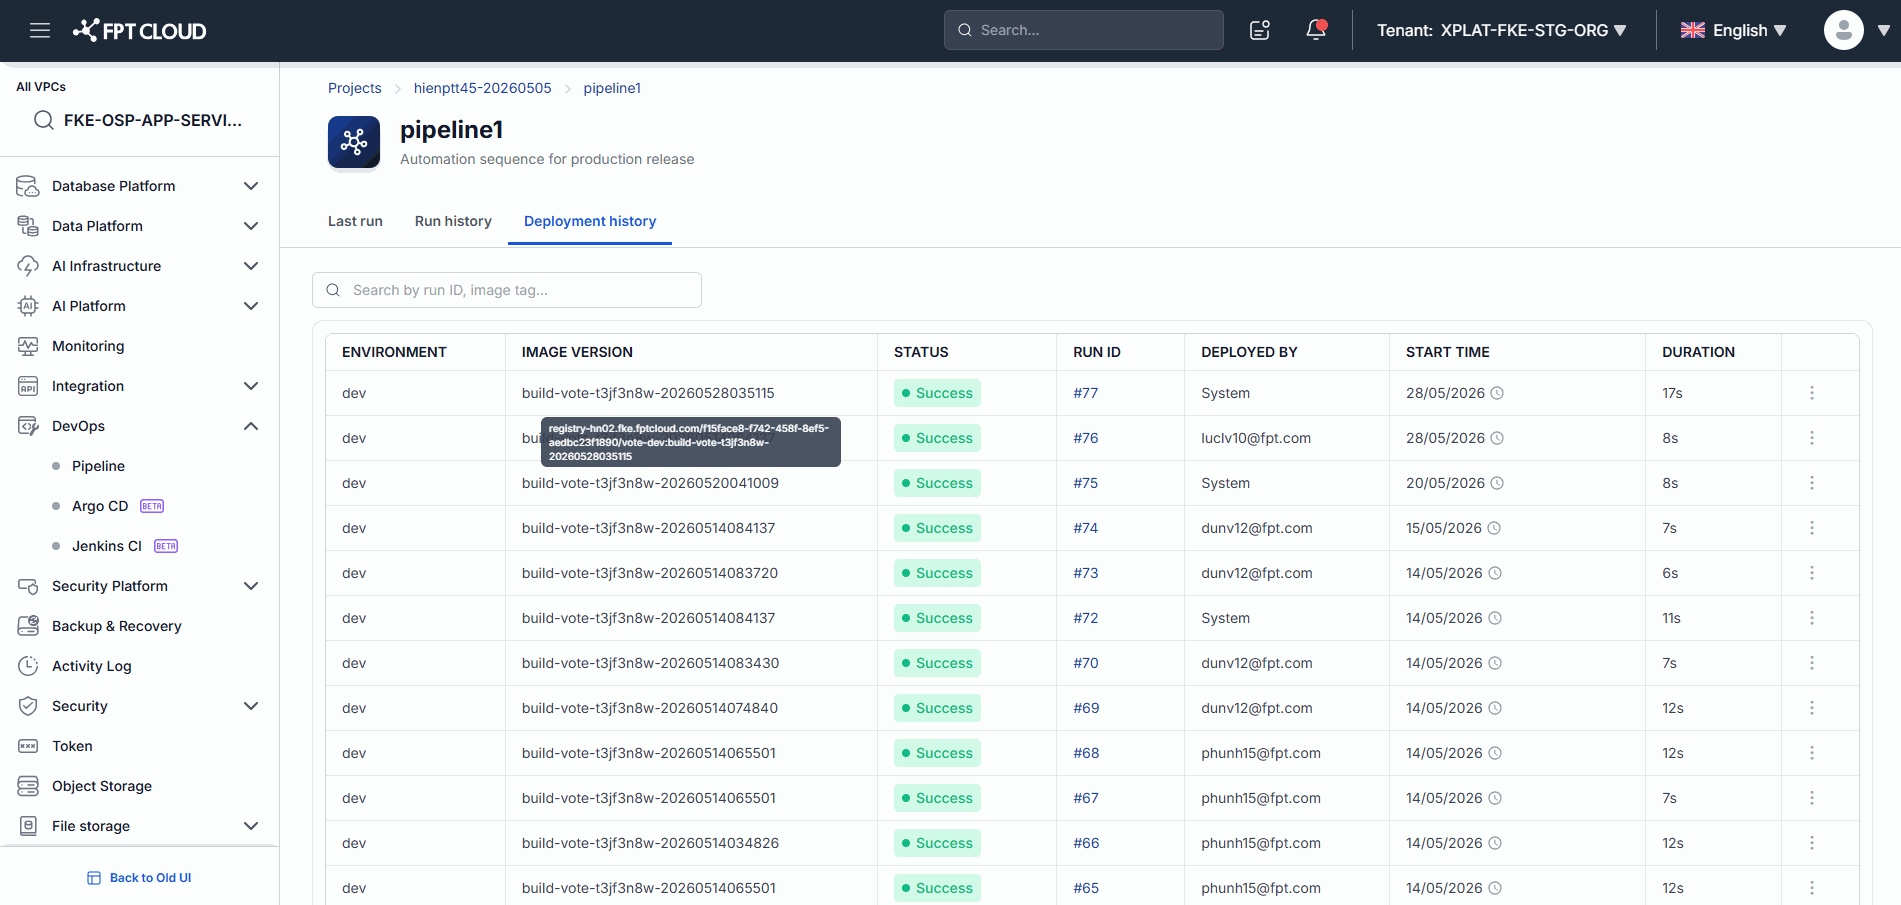
💡 This is useful for confirming exactly which build is running on the environment, especially when debugging or rolling back.
3.4 View Related Run
Option 1: Click the (⋮) icon in the deployment's row and select View run.
Option 2: Click the Run ID directly in the row.
The system navigates to the Run Detail screen of the Pipeline Run that created this Deployment.
⚠️ If the Run ID no longer exists in the system, the View run button is disabled.
4. Common Issues
| Issue | Cause | Resolution |
|---|---|---|
| "Run history" tab not visible or not clickable | No Pipeline view permission | Contact Admin to request access |
| "Run history" option is greyed out in dropdown | Pipeline has never been run | Run the Pipeline at least once first |
| No results after searching | Keyword is incorrect or less than 2 characters | Enter at least 2 characters; verify Run ID, branch, or commit |
| "Re-run" button is disabled | The original run is still Processing | Wait for the current run to finish, or Stop it first |
| Re-run returns "Config no longer valid" | The original run's config has been deleted | Create a new run from the current Pipeline configuration |
| "Stop" button not visible | The run is not in a Processing state | Stop is only available for running runs |
| Commit ID is not clickable | The external Repository is unavailable | Check the Git Repository connection |
| Actor shows "Unknown user" | The triggering user no longer exists in the system | Normal display — no action needed |
| "Deployment history" tab not visible | No Pipeline view permission | Contact Admin to request access |
| Screen shows "No deployments found" | Pipeline has no deployments yet | Perform at least one deployment first |
| "View log" button is greyed out | The Deployment has no log yet | No action needed |
| "View run" button is greyed out | Run ID no longer exists | The Run has been deleted — cannot be recovered |
| "Cancel" option not shown or greyed out | Deployment is not in a Processing state | Cancel is only available for running deployments |
| "Deployed by" shows "Unknown" | The triggering user no longer exists | Normal display — no action needed |
| "Deployed by" shows "System" | Deployment was triggered automatically | Normal display for auto-deployment |
5. Tips
💡 Combine Filter and Search to quickly narrow results when the run list is long.
💡 Click the Run ID directly to access Run Detail instead of using the ⋮ menu.
💡 Check the Last run tab to quickly see the most recent result without scrolling through the list.
💡 Filter by Status = Fail to quickly find runs that need attention.
💡 Re-run saves time when you need to test again with the same source code, especially for transient failures like network timeouts.
💡 Hover over Artifact Version to see the full image tag — useful when verifying exactly which version is running on the environment.
💡 Check the Deployed by column to distinguish between manual and automatic deployments.