Theo dõi Usage & Billing
Mở Usage & Billing
Ở sidebar bên trái, trong Dedicated Inference, nhấn My endpoints, rồi nhấn tab Usage & Billing.
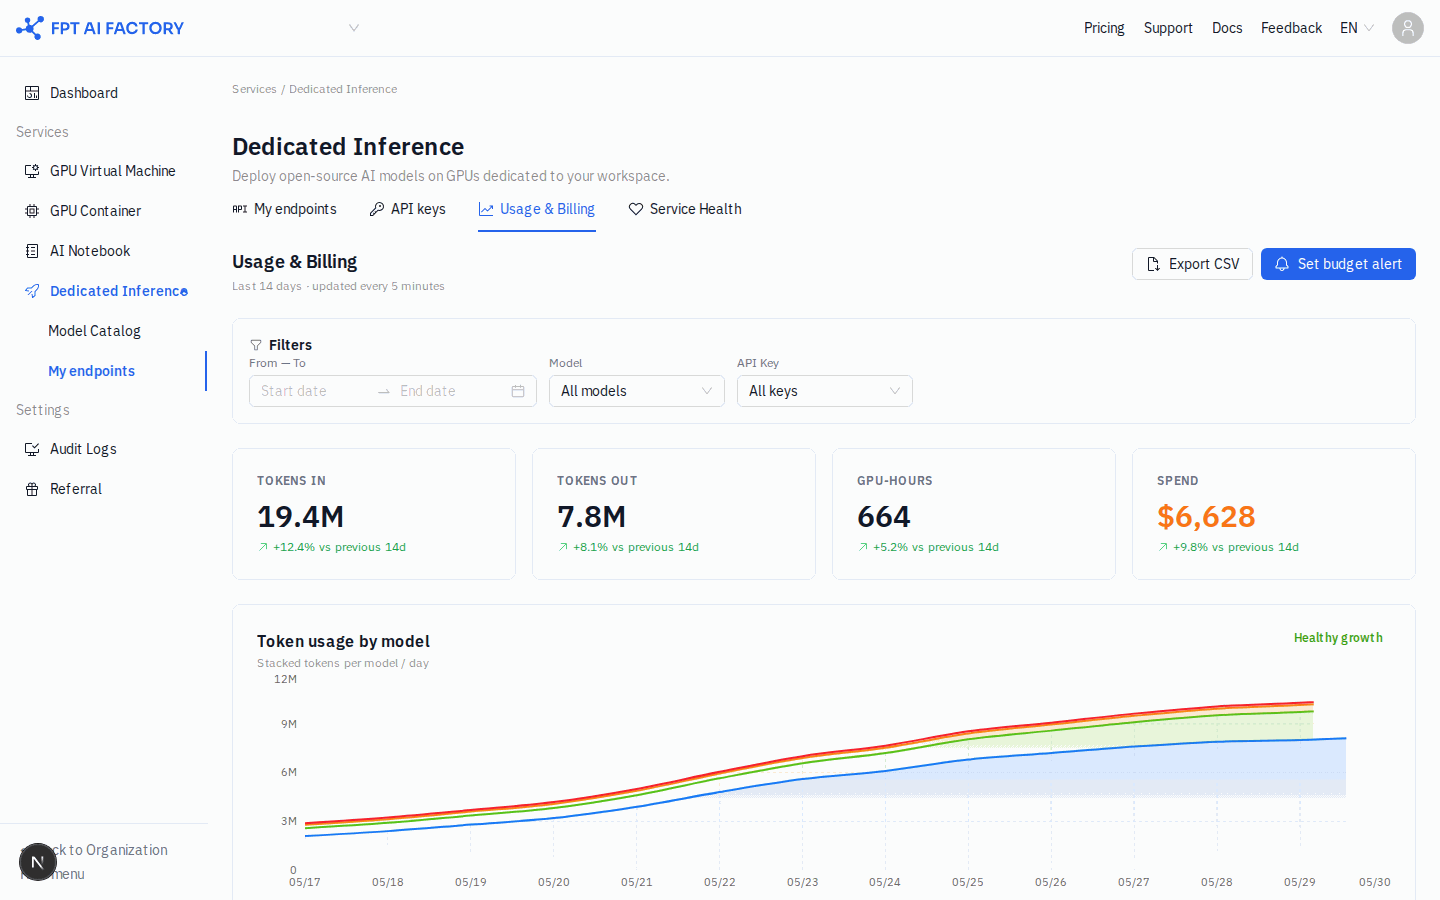
Tiêu đề trang: Usage & Billing Last 14 days · updated every 5 minutes
Lọc dữ liệu
Dùng phần Filters để lọc đồng thời toàn bộ biểu đồ và bảng:
| Bộ lọc | Tùy chọn |
|---|---|
| From / To | Khoảng ngày và giờ |
| Model | All models hoặc một model cụ thể |
| API Key | All keys hoặc một key cụ thể |
Thẻ KPI
| Thẻ | Ý nghĩa |
|---|---|
| TOKENS IN | Token đầu vào đã dùng trong khoảng đã chọn |
| TOKENS OUT | Token đầu ra đã sinh trong khoảng đã chọn |
| GPU-HOURS | Tổng GPU-hours đã đặt trước — đây mới là phần quyết định hóa đơn |
| SPEND | Tổng chi phí (USD) trong khoảng đã chọn |
Mỗi thẻ hiển thị tỷ lệ thay đổi so với 14 ngày trước đó.
ghi chú
TOKENS IN và TOKENS OUT chỉ ghi nhận để phân tích. Chi phí tính theo capacity (GPU-HOURS), không theo token. Phí tính theo phút, tối thiểu 60 giây và làm tròn lên.
Biểu đồ
- Token usage by model — Stacked tokens per model / day: lượng token đã dùng theo từng model qua thời gian.
Xuất dữ liệu
Nhấn Export CSV để tải dữ liệu đã lọc dưới dạng file CSV, phục vụ báo cáo hoặc gửi cho bộ phận tài chính.
Đặt cảnh báo ngân sách
Nhấn Set budget alert để cấu hình ngưỡng chi tiêu hàng tháng. Bạn sẽ nhận thông báo khi chi tiêu chạm ngưỡng đã đặt.