Giám sát workspace
Theo dõi metric của các dịch vụ trong workspace trên dashboard giám sát. Kết nối workspace với Monitoring Workspace, rồi import template dashboard.
Điều kiện cần
- Quyền xem tab Monitoring của workspace. Nếu không có quyền này, tab hiển thị "You do not have sufficient permissions to view this page!".
- Template dashboard của service bạn muốn giám sát. Xem Tải template dashboard.
Kết nối workspace với hệ thống giám sát
- Chọn Data platform → Workspace management, rồi chọn workspace.
- Chọn tab Monitoring.
- Kiểm tra thông tin Monitoring Workspace trong bảng.
- Ở cột Action, chọn Integrate.
Portal kết nối workspace với Monitoring Workspace.
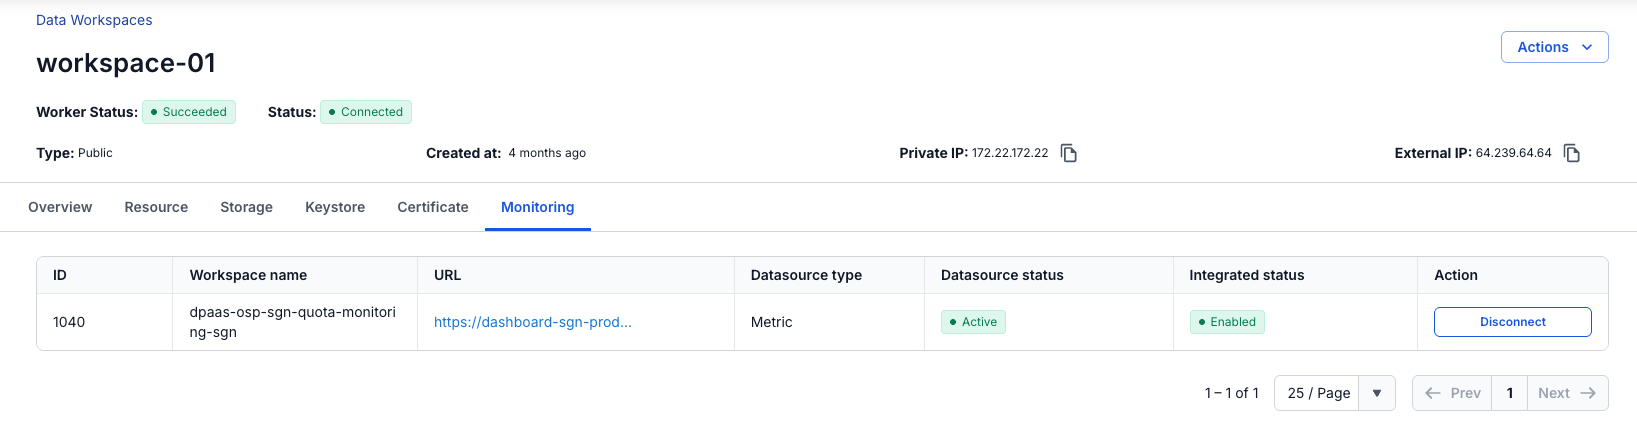
| Cột | Mô tả |
|---|---|
| ID | ID của Monitoring Workspace. |
| Workspace name | Tên của Monitoring Workspace. |
| URL | Đường dẫn tới dashboard giám sát. |
| Datasource type | Loại datasource, Metric. |
| Datasource status | Activating, Active, Active Failed, Inactive hoặc Deactivate Failed. |
| Integrated status | Enabled hoặc Disabled. |
| Action | Integrate kết nối workspace. Sau khi kết nối, nút này đổi thành Disconnect. |
Workspace đã kết nối hiển thị Active ở Datasource status, Enabled ở Integrated status và Disconnect ở cột Action.
Sau khi bạn chọn Disconnect, workspace ngừng gửi dữ liệu giám sát tới Monitoring Workspace.
Mở dashboard giám sát
Mở dashboard sau khi đã kết nối workspace.
- Chọn Data platform → Workspace management, rồi chọn workspace.
- Chọn tab Monitoring.
- Chọn đường dẫn ở cột URL.
Dashboard giám sát mở ra trong một tab mới của trình duyệt.
Tải template dashboard
Mỗi service có một template dashboard riêng, là một file JSON. Tải template của từng service bạn muốn giám sát.
| Service | Template |
|---|---|
| Orchestration (Airflow) | airflow-dashboard.json |
| CDC Service | cdc-dashboard.json |
| Flink | flink-dashboard.json |
| Query Engine (Trino) | trino-dashboard.json |
Import template dashboard
Import template để có dashboard cho các dịch vụ của workspace. Thực hiện các bước sau trên dashboard giám sát.
- Ở menu bên trái, chọn Dashboards.
- Chọn New → New folder.
- Nhập tên folder, ví dụ
Workspace Monitoring, rồi chọn Create. - Mở folder vừa tạo, rồi chọn New → Import.
- Trên màn hình Import Dashboard, chọn Upload JSON file, rồi chọn file template bạn đã tải về. Bạn cũng có thể kéo thả file vào màn hình.
- Chọn Load.
- Kiểm tra Name, UID và Folder của dashboard.
- Chọn Import.
Dashboard được tạo và hiển thị metric của service. Dùng các danh sách ở đầu dashboard, như Workspace, để chọn dữ liệu cần xem.